Fifty Percent Increase in Higher Education Enrolment by 2035 Possible (Full Article)
Is Fifty Percent GER at Higher Education Level by 2035 Possible?
Arun C Mehta
Formerly Professor & Head of EMIS Department
NIEPA, New Delhi
E-mail: acmehta100@gmail.com
Introduction
Much before the National Education Policy (NEP) 2020, the Government of India through the University Grants Commission and the Department of Higher Education, Ministry of HRD/Education resolved to achieve a Gross Enrolment Ratio (GER) of 30 percent at the higher education level by the year 2020. Rashtriya Uchchatar Shiksha Abhiyan of the Ministry of Education also set a GER target of 32 percent at higher education level by the year 2022. Apart from 50 percent GER at the higher education level by the year 2035, the following are some of the other important policy resolutions as specified in the National Education Policy 2020 which was approved by the Union Cabinet in its meeting held on 29th July 2020 under the Chairmanship of the Prime Minister of India.
- Multi-disciplinary holistic education at the undergraduate level
- Under Graduate degree to be of either 3 or 4 years, with a provision to issue certification after completion of each year
- Higher Education Body Commission of India to be the single umbrella for higher education
- Aim to achieve 100 percent youth and adult literacy by 2030
- Education sector to reach 6 percent of GDP at the earliest (from its present 4.6 percent)
- Multidisciplinary Education & Research Universities are to be set up in each district
- Students from underprivileged classes to be incentivized per merit
- Expansion of Open and distance learning across the country
- Graded accreditation & autonomy to achieve excellence in the next 15 years
- Comprehensive National Curriculum Framework for Teacher Education to be formulated
- To promote the use of technology, National Educational Technology Forum to be formed; etc.
Tables 50% Increase in Higher Education Enrolment by 2035 Arun C Mehta
Enrolment projections at School Education Level in India
Projection and Trends of School Enrolment by 2025, NCERT 2022
In addition to the target to achieve a 100 percent Gross Enrollment Ratio at school education level by 2030, the following proposals have also been made in NEP 2020 concerning school education in India; instead, the target would have been fixed to achieve a 100 percent adjusted-Net Enrolment Ratio (Adjusted-NER) which is considered a better indicator of participation. In this brief note, we examine whether the Higher Education level alone is capable of achieving a 50 percent GER from its 2018-19 level in the year 2035? Is a moot question that has been examined from different angles including the present status of school education in general and secondary & higher secondary levels in India, in particular. What would be the size of higher education enrolment; if 50 percent GER is to be obtained in 2035 will be another question that would be explored. This has become more so important given the pandemic because of which a significant decline in enrolment in general and school education, in particular, is expected in years that follow, and enrolment at a higher education may also not escape. In addition, the slow down of the economy (GDP contracted by 7.3 percent. in 2020-21) may also adversely affect enrolment at higher education level from the year 2020-21; and thereafter until the economy gets back on to the recovery path which may not happen in the immediate near future
- Target to achieve 100 percent GER in school education by 2030
- Education for all children between 3-6 years by 2025
- Replacing the existing 10+2 with 5+3+3+4: After five years in pre-primary, students to aim at enhanced skills in the new pedagogical system
- Medium of instruction till Class 5, to be home language or mother tongue
- Board examination to be broken into two, to test core capabilities
- Emphasis on socially disadvantaged, girls, socio-cultural identity children for education
- By 2025, at least 50 percent of students to have exposure to vocational education; etc.
Many of these policy resolutions like the 6 percent expenditure of GDP on education are not new and were also part of the various commissions and committees constituted by the Government of India from time to time including the National Education Commission (1964-1966), popularly known as Kothari Commission. While on the one hand, NEP 2020, clearly specified the year by which the improved GER at higher education level (by 2035) and 100 percent GER at school education level (by 2030) is to be achieved but fail to specify the year by which 6 percent expenditure of the GDP will be attained; rather it has simply said it be achieved at the earliest which has not seen the light of the day even after more than five decades after the same was first recommended. Before we examine the present status of higher education in India and the implication of achieving 50 per GER by 2035, let us first discuss and re-define the Gross Enrolment Ratio.
Redefining Gross Enrolment Ratio
Unlike school education level at which enrolment based indicators such as Gross & Net enrolment ratio as well as Age-specific and Adjusted-NER are frequently computed and use in plan formulation, at the higher education level only Gross Enrolment Ratio is being used to examine the participation of a relevant age-specific population i.e. 18 to 23 years in the higher education programmes. For calculating GER at any level of education, information on total enrolment in a year and the corresponding age-specific population in that year is required. While total enrolment and its male and female bifurcation, as well as enrolment by the social category i.e. Scheduled Castes & Scheduled Tribes, is available from the All-India Survey on Higher Education (AISHS, latest for 2019-20) but the same is not true for the corresponding age-specific population the main source of which is the Census & Registrar General of India, the latest Census figures being available for the year 2011. In the absence of an official projected population based on the 2011 Census, earlier projections based on population up to 2001 are being used by the Ministry of Education to estimate the age-specific population in a year which is adjusted given the total 2011 Census population (details can be seen under the Statistics Section of the Official Website of Department of School Education & Literacy). Because of the limitations in the projected population, GER and other enrolment-based indicators have been seen off the mark in the past decade which is true for all levels of education. Therefore, the latest GER for 2019-20 and also in the past years, the same must be analyzed in light of these limitations. With 50 percent GER at the higher education level, the quantum increase of enrolment in absolute terms cannot be known unless the reliable estimate of the population between the age-group 18 to 23 years is known in the year 2035. The GER for the year 2021 based on the actual Census 2021 population when available may reveal the real situation concerning the participation of 18 to 23 years population in higher education programmes; it is likely to show a declining trend because of the ongoing pandemic across the country.
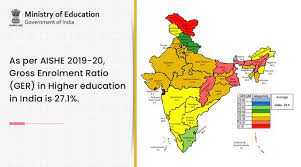
As per AISHE 2019-10, the GER at the higher education level increased to 27.1 percent from its previous level of 26.3 percent in 2018-19. On the other hand, in absolute terms, the higher education enrolment increased from 37.4 million to 38.5 million during the same period; thus showing an increase of 1.1 million or 2.94 percent over the previous year. A Gross Enrolment Ratio of 27.1 percent roughly indicates that the balance of 72.9 percent population of age group 18 to 23 years is not enrolled in higher education programmes. Can all the remaining 72.9 percent population be treated as out of the education system? Certainly not as a few of them may still either be enrolled in lower levels (not completed higher secondary level), a few of them maybe never enrolled or dropped out from the system, or a few of them may also be enrolled in foreign universities? Compared to overall GER at higher education level, though improved, the GER of Scheduled Castes & Scheduled Tribes population is still low at 23 and 18 percent respectively as against 26.9 percent for male and 27.3 percent for female population. Time has come to explore alternate enrollment-based indicators also for the higher education level (Mehta, 2002). Can higher education grow independently? Can higher education enrolment grow independent to the lower level i.e. higher secondary level which is expected to send graduates to it? Certainly not. Deliberations by Varghese & Mehta (1999) in the case of a World Bank-assisted study on the Upper Primary level of education is worth mentioning.“Universalization of upper primary education in India is normally discussed in terms of enrolling and retaining all children belonging to the age group 11 to 14. This seems more to be a desirable goal to be achieved in the long run than a realizable target at the present levels of development of primary education. Enrollment is a function of the relevant age group at the primary level of education. However, enrolment in upper primary schools is more a function of primary education completion rates than a function of the relevant age group. It is logical to argue that all children in the relevant age group (11 to 14) cannot be enrolled in upper primary classes unless they complete the primary level of education. In other words, all relevant age group children can be provided upper primary education only when all children of the primary school-going age group are enrolled, retained, and complete the primary stage of education. Since primary education is not yet universalized, this implies that the universalization of upper primary education means providing upper primary education for all children who have completed the primary level of education. The present study has adopted this as the operational definition of universalization of upper primary education in India. However, once universalization of primary education is attained, then there cannot be any difference between providing the upper primary level of education to all age group children and those who complete the primary stage of education. The effort at present needs to be to improve the inter-stage transition ratios from primary to upper primary levels of education.”
The above argument is also very much true for the higher education level which will grow in the line of enrolment at the immediate lower level, i.e. higher secondary level which is supposed to supply a continuous flow of higher secondary graduates to the higher education level. This means that the population of age 18 to 23 years, all cannot be admitted to the higher education system simply because of reason that they are not eligible. Higher education level can only accommodate higher secondary graduates. In the light of these observations, there is a need to redefine the Gross Enrolment Ratio at the higher education level to get a better picture of the participation of the relevant age population in higher education programmes. Therefore, instead of a total 18 to 23 years population, the number of higher secondary graduates may be considered in computing ratio which can be termed as Effective Enrolment Ratio at the higher education level.
Another indicator that plays an important role for enrolment at the higher education level to grow is the transition rate from higher secondary to higher education level which can be computed by using the number of higher secondary graduates the system has produced in the previous year to the total number of students admitted in the first year of graduation during the next year is multiplied by 100 to get the transition rate. The future course of enrolment at the higher education level will be guided by these two indicators. Unfortunately, both of these indicators are not readily available from official sources. Based on few assumptions, NIEPA (December 2020), in its recent study on NEP 2020: Implementation Strategies attempted transition rate from secondary to higher education level (88.1 percent) and used the same in building up different developmental scenarios towards assessing the NPE 2020 goal of 100 percent GER at school level in 2030 and 50 percent GER at the higher education level in 2035. In the light of these observations policy directive of 50 per GER at higher education level should be examined in terms of effective-GER and transition rate from higher secondary to the higher education level rather than simply based on GER. A low transition rate may adversely affect prospects of higher education enrolment to grow in the years that follow.
Effective-Enrolment Ratio = Number of students admitted in the first year of graduation in a year is divided by the number of higher secondary graduates the system has produced in the previous year is multiplied by 100
Transition Rate from Higher Secondary to Higher Education Level = Number of higher secondary graduates the system has produced is divided by the number of students admitted in the first year of graduation level during the next year is multiplied by 100
Projected Population (18 to 23 years)
To know the size of the higher education enrolment in 2035, we need a projected population of age-group 18 to 23 years in that year. Generally, population projections are made available from sources, like United Nations Population Division (UNPD), the World Bank, and the United Nations Population Fund (UNFPA). In addition, individual researchers also provide projections for the country as a whole or even at the sub-national level. It was also a practice of the Registrar General & Census Commissioner, India to undertake projections immediately after the latest census figures are out on behalf of the Planning Commission (now renamed as NITI Aayog) who in turn used to set up a committee of experts which was first constituted in the year 1958 which continued up to the Census 2001. Unlike the previous constitution of the Expert Committees, the Technical Group on Population Projections based on the 2011 Census was constituted by the National Commission on Population, Ministry of Health & Family Welfare, Government of India on July 2014 report of which was made available in the public domain as late as on July 2020. In the absence of the Official Projections enrollment-based indicators, such as GER were computed based on the adjusted projections made earlier based on up to the 2001 Census. Since the Official Projections were released in July 2020 and AISHE 2018-19 in August 2019, AISHE couldn’t use the Official Projections made available by the Technical Group on Population Projections. But AISHE 2019-20 GER which was released in June 2021 is also not based on the official projections for the unknown reasons.
GER 2019-20: Based on Expert Committee & United Nations Projections
By using the adjusted population (18 to 23 years), the Gross Enrolment Ratio at higher education level obtained through the AISHE 2019-20 comes out to be 27.10 percent: Total enrolment, 38.53 million & age-specific 18 to 23 years population, 142.20 million. In the light of the Expert Committee projections, the same can now be re-calculated for the year 2019-20 (Table 1). The age-specific population (18 to 23 years) based on the Expert Committee projections in 2019-20 comes out to be 150.79 million which gives a GER of 25.55 percent; a difference of 1.55 percentage points. It is hoped that AISHE while presenting GER 2020-21 will not only use the Expert Committees projections for 2020-21 but may also like to revise its previously computed GER during the period 2011-12 to 2019-20. An attempt has also been made in the present article to re-calculate GER in the light of the Expert Committee projections during the period 2011-12 to 2019-20 and the same separately for the male as well as for female population is presented in Table 2 along with the GER published by the AISHE which reveals a slight variation in both the estimates in the initial years but the same in the later years, especially in the years 2018-19 & 2019-20, as reported above, is found significant which is true for both the GER of the male and female population.
In addition to the Expert Committee, projections are also made available by the United Nations in 2019 (Department of Economic and Social Affairs, Population Division: World Population Prospects 2019, accessed on June 3, 2021, from https://population.un.org/wpp/DataQuery/e). As per these projections, India would have had a total population of 1366.42 million in 2019 to which, if a percentage of 11.33 is applied will give a total of 154.82 million population in the age group 18 to 23 years. Using the United Nations projections and a total enrolment of 38.54 million, gives a GER of 24.89 percent in 2019-20 which is quite similar to one estimated based on the Expert Committee projections. Thus both the estimates of GER computed based on the Expert Committee (25.55 percent) and United Nations projections (24.89 percent) suggest that GER 2019-20 is a bit lower than one provided by the AISHE (27.1 percent).
Size of Enrolment, if a GER of 50 Percent is achieved in 2035
The details of the Expert Committee projections are presented in Table 1 which reveals that India’s total population is expected to be 1513.6 million in 2035 as against 1553.7 million projected by the United Nations (2019); actual Census 2011 population being 1210.9 million. In this note, Official Projections (July 2020) made available by the Technical Group on Population Projections set up by the National Commission on Population (Government of India) has been used to estimate the quantum of the enrolment in 2035 in the absolute and percentage form. The total population of India is expected to grow at an annual rate of 0.9196 percent per annum or 311.43 million in absolute terms between the years 2011 to 2036. The share of the 18 to 23 years old population to total population in the 2011 Census was 11.38 which as per the Expert Committee projections is likely to be declined to 9.18 percent in 2035; the year by which India desires to attain a GER of 50 percent. The size of the 18 to 23 years population in 2035 is likely to be 138.99 million. To attain 50 percent GER, the size of higher education enrolment in 2035 would be required to be 67.12 million which is 74.17 percent higher than the actual AISHE enrolment in the year 2019-20. Thus to attain a GER of 50 percent in 2035, higher education enrolment will be required to grow at an average annual growth rate of 3.53 percent per annum. Will it be possible? To know it below we examine the growth of higher education enrolment in India, we analyzed both the absolute and average annual growth rate between different periods. We would also explore whether it be attained at the current status of school education in India.
Challenges Ahead to Meet 50 Percent GER
Given the growth rate achieved in enrolment at the higher education level in the past, with a little push achieving a growth of 3.53 percent per annum to attain a GER of 50 percent in 2035 looks achievable. A look at the Tables 2 & 3 reveals that enrolment at the higher education level increased at an annual compounded rate of 3.58 percent during the period 2011-12 to 2019-20 the same in case of female enrolment (4.77 percent) was significantly higher than their male (2.46 percent) counterpart during the same period. In the initial period (1950-51 to 1960-61) just after the independence, female enrolment increased at an annual rate of 14.05 percent compared to 8.51 percent in the case of male enrolment. However, thereafter the same could able to increase with every passing year but couldn’t maintain the pace. However, all during the years, the rate of increase was never below1.98 percent except the period 1980-81 to 1990-91. Further, it has been observed that the higher education enrolment experienced a high growth rate of 11.83 percent during the decade 2000-01 to 2011-12; again growth rate in case of female enrolment (13.26 percent) was significantly higher than their counterpart males (10.81 percent) which may be attributed to more number of higher education institutions including the independent institutions included in the data collection as well as the inclusion of any course, like hotel management, nursing, etc having a duration of three years after the higher secondary level when the AISHE was launched in the year 2011-12. Thereafter, higher education enrolment couldn’t look back and maintain its increasing trend during the remaining period of AISHE (up to the year 2019-20). As has already been mentioned above the same has increased at an average annual rate of 3.58 percent per annum during the period 2011-12 to 2019-20. During recent years, the growth rate of women’s enrolment has been higher than the men’s enrolment which looks to reach the saturation point. Further, it has been observed that the average annual growth rate during the period 2012-13 to 2019-20 each year further reveals that the same has consistently increased and was above 3.53 percent each year, 7.31 percent being the highest during the period 2012-13 to 2013-14 all which suggest that the same remained higher than the required growth rate of 3.53 percent per annum to achieve the targeted 50 percent GER/3.53 percent annual growth rate in 2035.
Separately, a glance at the undergraduate level (Table 3) reveals that the same has also been consistently increased from 23.9 million in 2012-13 to 29.8 million in the year 2018-19; but declined slightly to 29.6 million in 2019-20, the year for which the AISHE is the latest available. Further, it has been observed that the share of undergraduate enrolment to total higher education enrolment is about 80 percent which is also true separately for men and women enrolment however women enrolment at 80.26 percent is slightly higher than their male counterparts. During the same period, the GER at the higher education level has also shown a consistent improvement which in the latest AISHE year is 27.1 percent for total enrolment as against as GER of 26.9 percent in case of men and 27.3 percent for women enrolment. Further, a look at the percentage share of women’s enrolment to total enrolment at the higher education level also shown a consistent increase which was as low as 11.30 percent in 1950-51 but further increase to 39.30 percent in 2008-9 and 49.03 percent in 2019-20. As it seems that with a little push, the share of women’s enrolment may further move towards 50 percent of the total higher education enrolment.
The Way Forward
The growth in higher education enrolment which has been attained since the independence and more specifically in the recent past is termed impressive and has been achieved during the normal course of time when there was no epidemic like the COVID-19 and the ongoing pandemic which has changed the lives of many. The COVID-19 pandemic has affected educational systems across the World, leading to the closures of schools, universities & colleges, and other such institutions. According to UNESCO, around 1.4 billion learners across the world were not able to attend school or university. The impact was more severe for the disadvantaged and socially deprived sections of the society and their families, causing economic hardships on families. It is not that the lives of only the students have been affected but their parents are also badly affected, many of who have lost their jobs and those who could manage their jobs, the salaries have gone down, many of the parents remained without salaries and few of them are still without the salary. The Centre for Monitoring Indian Economy (CMIE) based on the 30-day moving average estimated that as of 5th June 2021, the unemployment rate which remained high at 12.57 percent has badly affected both the rural (11.5 percent) and urban (15.5 percent) areas of the country. The average unemployment rate for May 2021 stood at 11.90, 14.71, and 10.63 percent respectively in all, urban, and rural areas which were as high as 45.6 percent in the case of Delhi. CMIE further estimated that because of lockdown due to pandemic in different states there was a loss of as many as 7.46 million jobs in April 2021 which affected both the salaried and non-salaried jobs. As per CMIE, a total of 10 million people lost their jobs during the second pandemic and the income of about 97 percent of the households’ has declined since the beginning of the pandemic last year. A good number of workers in the fear of long lockdown migrated to their home town mostly to the rural areas which were as high as 800 thousand alone in Delhi; this affecting education of their wards. Many of them may remain in villages and a few of them may not return to work; thus significantly affecting the education of their wards. Those who manage to continue their jobs but with a reduced salary, many of them have migrated their wards from low-fee private schools to government schools. In addition, children of government schools and their parents who migrated to villages may see a steep decline in enrolment in government schools in 2020-21 data collection of which is currently undergoing across the country.
GER of 100 percent at School Education by 2030
Needless to say that higher education level cannot grow independent to school education because of which as mentioned above NEP 2020 envisages attaining a GER of 100 percent in case of school education in India by the year 2030. To view the current status of school education in India and whether the same is in a position to help India in attaining a GER of 100 percent in 2030, various enrolment and efficiency-related indicators including the retention and transition rates have been critically analyzed during the period 2017-18 & 2018-19. Higher education enrolment is not expected to increase unless the efficiency of the school education system is improved to a significant effect which at present is found to be a highly inefficient one and also the quality of enrolment statistics has deteriorated recently because of the erratic enrolment at the elementary level of education. Unlike AISHE, UDISE+ is not yet available for the year 2019-20 as the time-lag in school education statistics has recently increased significantly.
Enrolment-based Indicators
Gross & Net Enrolment Ratio as well as Age-specific Enrolment Ratio and Adjusted-NER at different levels of schools education and corresponding age-group, such as 6 to 10+, 11 to 13+, 6 to 13+, etc. have been analyzed (Table 4). In addition, efficiency indicators, such as, average annual drop-out rate, retention, and transition rates both at the state as well as at all-India level have also been analyzed all of which have implications for India achieving the goal of universal school education & high GER at the higher education level.
Table 4 presents a variety of enrolment-based indicators at different levels of education at the all-India level which reveals that despite significant improvement in all spheres of school education in India, the goal of universal school education is still a far distant dream which is not likely to be realized shortly. Enrolment decline during 2018-19 over the previous 2017-18 is in the tune of 2.63 million will further deteriorate efforts being made towards achieving the goal of school education in general and universal primary education in particular which is reflected in enrolment ratio at the primary level of education. During 2017-18 to 2018-19, enrolment in Grade I declined to 24.75 million from 25.09 million in 2017-18; thus showing a decline of 0.34 million in absolute terms or 1.3 percent in percentage form. It is also worth mentioning that a huge decline of about 59 million enrolment was noticed in 2017-18 when Student Data Management Information System (SDMIS) in-sync with U-DISE was launched in 2016-17.
Primary Level
Irrespective of a type of enrolment ratio, a steep decline has been observed across enrolment types amongst which GER at the primary level is the steepest one which has decline to 92.56 in 2018-19 from its previous 102.79 level in 2017-18 because of which enrolment ratio at upper primary, secondary and higher secondary levels may see a steep decline in years that follow (Table 4).
A Gross Enrolment Ratio of 92.56 percent in 2018-19 indicates that roughly about 7 percent of children including the overage and underage ones are yet to be enrolled against which 89.14 percent children of age 6+ to 10+ years are enrolled in Grades I to V; thus indicting that remaining 11 percent children are not enrolled in Grades I to V but all of them may not be treated as out of school as a few of them may be enrolled in higher grades for which the Adjusted-NER is computed. A 93.60 percent Adjusted-NER indicated that about 94 percent of the total 6+ to 10+-year-old children are enrolled but not necessarily in the corresponding Grades I to V. This otherwise also indicate that the remaining 6 percent of the total 6+ to 10+ years-old children are not enrolled either in corresponding Grades I to V and or higher grades. On the other hand, 94.26 percent Age-specific Enrolment Ratio indicates that more than 94 percent of the total 6+ to 10+-year-old are enrolled and the remaining 6 percent are yet to be enrolled which is huge if the size of the population is somewhat 118 million. It may also be observed that 2018-19 figures are that of before COVID-19 which was first noticed in January 2020 in India because of which schools may experience a large number of dropouts which is not confined only to government schools but has also affected small private unaided schools. The year 2020-21 & 2021-22 may see a further decline in enrolment; thus affecting severely efforts being made in India towards universal school education. It is also interesting to observe that except Lakshadweep, all other States & UTs have shown a significant decline in GER in 2018-19 over the previous year 2017-18; all of which indicate far-reaching implications for other levels of education to grow (Table 5).
Upper Primary Level
Net Enrolment Ratio at Upper Primary level indicate that the same has declined to 68.99 percent in 2018-19 from its previous level, 70.52 percent thus indicating that about 31 percent of the total 11+ to 13+ year children are not enrolled in the corresponding Grades VI to VIII which is considered as huge towards achieving the goal of universal elementary enrolment (Table 5). On the other hand, a 76.97 percent Adjusted-NER indicates that about 33 percent of the total 11+ to 13+ children are yet to be enrolled in corresponding Grades VI to VIII or higher grades. On the other hand, 88.55 percent Age-specific enrolment ratio at the upper primary level indicates that about 11 percent of children of age-group 11+ to 13+ are yet to be enrolled. State-specific NER at the upper primary level further indicates that the same has declined in 2018-19 in most of the states with Bihar (71.01 percent), Gujarat (72.80 percent), Jharkhand (71.18 percent), Madhya Pradesh (69.57 percent), Uttar Pradesh (58.26 percent) and West Bengal (71.65 percent) having low to very low NER all which indicate task ahead is challenging one and need meticulous planning at all levels of school education to attain 100 percent GER in 2030.
Elementary Level
In addition to primary & upper primary levels of education, enrolment ratios have also been analyzed at the elementary level of education. A NER of 81.46 percent at the elementary level indicates that a significant 19 percent of children of 6+ to 13+ years are not enrolled in the corresponding Grades I to VIII. The remaining children of this age group may either be out of school or a few of them may either be enrolled in higher grades (Table 6). Adjusted-NER further suggests that a little over 87 percent are enrolled either in Grades I to VIII or also in the higher grades. On the other hand, a 92.08 percent Age-specific enrolment ratio suggests that only 8 percent of children of 6+ to 13+ years are yet to be enrolled (15 million) which in absolute terms is huge as the size of the total population of this age group is 188 million. If India wants to achieve the goal of universal school enrolment in 2030, it has to give attention to large states, such as Andhra Pradesh, Bihar, Jharkhand, Gujarat, Madhya Pradesh, Odisha, Rajasthan, Uttar Pradesh, West Bengal, and other such states having low enrolment ratio at the elementary level of education.
Secondary & Higher Secondary Level
Quite disappointed to observe the status of secondary and higher secondary levels of education as the net enrolment ratio is reported to be as low as 48.60 and 30.78 percent respectively which indicate that more than 50 and 70 percent of children of the corresponding age groups in 2018-19 were yet to be enrolled (Tables 7 & 8). Can secondary and higher secondary levels grow independently to lower levels? Certainly not. Enrolment in secondary level i.e. Grades IX & X is not a function of the corresponding age-specific population i.e. 14-15 years but is a function of elementary graduates i.e. those who successfully pass Grade VIII. Thus unless the efficiency of the elementary level of education is not improved to a significant effect, neither the goal of universal secondary nor higher secondary education is expected to be achieved. Therefore, in the next section, a few of the efficiency-related indicators are critically analyzed which also plays an important role in ensuring 100 percent GER at school education in 2030.
Dropout Rate
On the one hand, there is a steep decline in enrolment and on the other hand, those who stay do not complete an educational level and leave the system before the completion. Table 8 presents the dropout rate at primary, upper primary and secondary levels of education for both Cohorts 2016-17 and 2017-18 in the case of General, Scheduled Castes, and Scheduled Tribes population. The drop-out rate at the primary level, irrespective of the social category has shown an increase for the 2017-18 cohort from its previous level i.e. Cohort 2016-17 which is obvious because of the steep decline in enrolment during 2017-18 and 2018-19. Of the total enrolment (123.81 million) in Grades I to V in 2016-17, 3.51 percent dropped out from the system before the completion of a grade as against 4.45 percent during the year 2017-18. It may be recalled that the size of enrolment in primary grades in 2017-18 was in the tune of 122.38 million in 2017-18. A 4.45 percent drop out at all-India level is termed as average annual drop out rate which over the primary cycle of five years come to around 17.8 percent which means that of the total enrolment in Grades I to V, roughly about 18 percent dropped out from the system before the completion of the primary level. Both the SC (5.16 percent) & ST (5,48 percent) categories also reported a high drop-out rate compared to 4.37 percent in the case of the OBC category. Barring the General category, contrary to general belief dropout rate in the case of boys is a bit higher than their counterpart girls which is true for the SC, ST, and OBC children.
A glance at the state-specific drop-out rate at the primary level of education (Table 9) further reveals that about 11 states have drop-out rates higher than the national average of 4.45 as against 10 states having lower rates at the upper primary level (national average 4.68 percent). At the secondary level, irrespective of boys and girls, the dropout rate is very high barring a few states such as Chandigarh, Himachal Pradesh, Lakshadweep, and Kerala. A few states from the north-eastern region, such as Arunachal Pradesh (13.78 percent), Meghalaya (16.88 percent), and Nagaland (11.41 percent) are having the drop out rate above 10 percent in case of primary level. On the other hand, Bihar (7.76 percent) and Uttar Pradesh (9.71 percent), the most populous states of the country having high dropout rate is unless checked, the goal of universal primary education may not be cherished shortly. At the upper primary level, Bihar (12.43 percent), Chhattisgarh (7.02 percent), Gujarat (7.39 percent), Jharkhand (10.21 percent), Madhya Pradesh (5.93 percent) and Uttar Pradesh (5.74 percent) have high dropout rate all of which suggests that the top most priority must be given to theses states to check high incident of drop out. Further, it has been observed that compared to drop out at the primary and upper primary level, the same at the secondary level is alarmingly high at 17.87 percent in addition to which states like Bihar also having a high drop out (28.46 percent) rate at this level of education. On the one hand, there is a high incidence of dropout at the primary level and those who complete the primary level do not stay and drop out before they complete the upper primary level of education. Besides, all those who complete the upper primary level of education, do not necessarily have been transited to the next level of education because of which the next indicator we discuss below is the transition rate (Table 10).
Transition Rate
The Transition Rate for the year 2017-18 presented in the Table 10 reveals that about 91 percent of children transit from the primary to upper primary level of education and no significant deviation is observed between boys and girls transition rate. However, more children from the general category (94 percent) transit from primary to upper primary level compared to 87, 88, and 89 percent of children respectively transit from the SC, ST, and OBC category. The transition rate remains almost stagnant for the past so many years. On the one hand, a good number of children left the system before the completion of primary level, and on the other hand, about ten percent of children drop out from the system in transition; thus severely affecting the efforts being made towards universal school education by 2030. There is no option but to improve the efficiency of the primary education system which must send an adequate number of primary graduates to the upper primary system. Thereafter children must continue in Grades VI to VIII and complete Grade VIII and transit to the first grade of the next higher level, i.e. Grade IX of secondary level. The gains that we achieved towards universal enrolment are slowly but surely being losing fast and we are back to square one. If not improved, India may not achieve a target GER of 100 percent by 2030 and a GER of 50 percent in 2035 at the higher education level as envisaged by NEP 2020.
The state-specific transition rate presented in Table 11 indicates that only three states, namely Bihar, Jharkhand, and Uttar Pradesh have a lower transition rate than at the national average of 91 percent from primary to upper primary level against 9 and 12 states from the elementary to secondary and from secondary to higher secondary level of education. Further, it is observed that the lowest 77 percent transition rate has been observed in the state of Bihar and the highest, 100 in a couple of states. Further, no significant difference is observed in boys and girls transition from the primary to upper primary levels of education and from elementary to secondary level of education; however, in a few states, more girls used to transit than their boy’s counterpart in case of secondary to higher secondary level of education. The transition rate in the most populous states of Bihar, Jharkhand, Madhya Pradesh, Rajasthan, and Uttar Pradesh is unless improved, India may not move towards achieving the goal of school education in the real sense. It is sorry to observe that in most of the efficiency and enrolment-based indicators no visible improvement has been noticed which is despite the nationwide programmes currently under implementation.
Retention Rate
The last indicator which we discuss below also falls under the category of efficiency indicators is retention rate at the primary and elementary level which gives us information about the retaining capacity of the system (Table 12). Grade V enrolment is linked to enrolment in Grade I five years back as against Grade VIII enrolment is linked to Grade I enrolment 8 years back and so at the secondary and higher secondary levels of education. A look at Table 12 reveals that that prima-facie it looks that both boys and girls almost equally retain which is true for all levels of education. A retention rate of 86.30 percent at the primary level of education indicate that only 86 of the total 100 children who entered the system five years back could able to reach Grade V; the balance of 14 children couldn’t reach Grade V in 2018-19 and dropped out from the system however a few of them still be in the system because of the repetition. It may be recalled that the average annual drop out rate in 2018-19 at the primary level presented above is 4.45 percent which also indicate that about 17.80 percent of the total enrolment in Grades I to V couldn’t remain in the system which is huge if the size of total primary enrolment is in the tune of 122.38 million. The retention rate of girls at the primary level of education (86.90 percent) is a bit higher than their counterpart boys (85.70 percent); which is also true for many states. On the other hand, 67 percent children of those who enrolled in Grade I eight years back could only reach Grade VIII in 2018-19 which otherwise indicate that 33 percent of the total enrolled couldn’t remain in the system; however, a few of them may still be in the system because of the repetition. On the other hand, only 56.90 and 38.00 percent could remain in the secondary and higher secondary levels of education indicating about 43 and 52 percent of the total enrolment couldn’t remain and dropped out from the system. Not only the universal secondary and higher secondary levels of education but even universal primary and elementary education is not in the sight which is quite similar to the situation a decade back.
Despite the high incidence of drop out a few could manage to complete primary, elementary and other levels of education. The GER, NER, Age-specific ER, Adjusted-NER, Transition Rate, and Retention rates analyzed suggest that even in quantitative terms India is still far away from attaining the status of universal primary education in a real sense less we achieve the universal elementary and secondary level of education. The low level of participation at the primary level and high incidence of dropout suggest that the system is inefficient and not supplying an adequate number of primary graduates to the upper primary level of education in the absence of which upper primary level of education is not adequately growing. Needless to mention that upper primary and other higher levels of education cannot grow on their own as upper primary is not a function of the corresponding age-specific population i.e. 11+ to 13+ years but it is the function of primary graduates. Therefore, there is no option but to improve the efficiency of the primary level of education and further improve the transition from primary to the upper primary level of education. None of the levels of education can grow independent to the immediate lower level which is also true for higher education level which as envisaged in NPE 2020 cannot attain a 50 percent GER unless the higher secondary level supplies an adequate number of graduates on regular basis.
Concluding Observations: Pandemic Likely Impact on Higher Education
Because of the facts presented above both the higher education as well as the school education sector will not remain the same like it was before the outbreak of the COVID-19. For about last more than 15 months no face-to-face learning is taking place which is true for all the levels of education in India. Even the Central Board of Secondary Education (CBSE) & Indian Certificate of Secondary Education (ICSE) has canceled the Board Examinations so as the host of the State Secondary Boards and National Institution of Open Schooling (NIOS); thus affecting everyone, rich or poor. Further, as per the Right to Education Forum, about ten million girls in India could drop out of secondary schools due to the pandemic; thus severely affecting enrolment at the higher education level in the years that follows. In addition, the recent steep decline in school education enrolment would also severely influence higher education enrolment to grow.
The post-pandemic impact on higher education is likely to be affected by both the face-to-face as well as distance learning modes. Both the students at home, as well as those who desire to join international universities and international students who desire to join the Indian higher education system, are expected to be severely affected by the COVID-19. Jain & Ruby (2020) discusses different dimensions which would have far-reaching implications for the enrolment at the higher education level to grow. The face-to-face programmes are affected by the high incidence of dropouts across the school levels of education. Part of the growth in higher education enrolment is because of private institutions that have almost trapped all the potential students who can pay the fee under its ambit but are not likely to maintain the momentum as they have almost reached the saturation point. Growth in higher education enrolment in the recent past is also attributed to increased distance learning through the online platform but the same, especially in the rural areas is marred by the high cost of contents as well cost and speed & stability of the internet connectivity. All these limitations are further compounded by the COVID-19 which would affect demand for higher education and parents’ choices for the same to which falling economy has added fuel in the fire; thus may likely to dent India’s efforts towards attaining a GER of 50 percent in 2035. The impact of COVID-19 on prospects of higher education enrolment is like to be more severe than the famous 2009 recession which the World had experienced. It may impact India more than the other countries as its economy in terms of GDP during 2020-21 is contracted by a historical 7.3 percent which may result in less funding for the educational programmes in general and higher education in particular which has already started reflecting into. Economy revival is not expected before the financial year 2022-23. Because of the fear of the spread of pandemic, schools, colleges, offices, institutions and universities are closed for almost 15 months and students both in schools and colleges, parents, teachers & faculty, administrators all stayed at home many of who as described above have lost jobs or their salaries have been cut significantly all which force parents to rethink about the education of their wards once the lockdown is over especially the higher education sector. Their capacity to fund higher education will now be re-evaluated once the pandemic is over. They may even decide to withdraw or stop funding higher education of their wards or may defer admission for a year or two all of which in addition to the availability of lower funds from the government sources; higher education GER may not escape the impact of all these factors. As has been presented above that because of the pandemic, the unemployment rate remained very high at 12.57 and loss of 7.46 million jobs all of which would affect demand for higher education in years to come. Parents may have no option but to withdraw their ward or postpone their admissions if the fee is not reduced or waived or financial assistance is provided to all those who lost their jobs or drawing low salaries and the impact of the pandemic is more on this segment of the population. As of now, no financial assistance has been promised by the UGC or the Central Government to the families affected the most all which would influence higher education enrolment to grow in years that follow.
Because of the pandemic, to reduce chances of infection and cost-cutting, students avoid traveling far places and look for opportunities nearby which resulted in a lack of adequate places in the local higher education institutions while at other locations the same may be found in surplus. As has been specified above those who were planning to go abroad for higher studies may now opt to skip because of the fear of infection and travel cost and look for opportunities locally near home or they may defer their decision for a year or two. Because of the comparatively low cost of higher education, India may attract a few additional international students both of which may help in increasing enrolment but may not affect GER to a great extent. If this is found true, India may expect to have students from diverse backgrounds in the year that follows. Alternatively, to avoids face to face learning, students may also look for opportunities in open and distance learning mode which may also result in low cost of education for which India may need to provide stable internet connectivity, especially in the rural areas which is need of the hour in addition to which we need to relook into the cost of distance and open learning programmes in India. NEP 2020 while envisaging a 50 percent GER by 2035 also based on the assumption that distance and open learning degree courses will play a pivotal role in achieving it. If we could provide affordable distance learning programmes, the same may also attract students towards higher education those who because of one or the other reasons couldn’t yet join the system. Available data further indicate that share of distance and open learning enrolment to total higher education enrolment is almost stagnant for the last so many years. We must now act to popularize distance learning programmes and ensure that they are treated at par with face-to-face programmes. Because of the COVID-19 and hardships, parents may like to move towards distance education programmes for which the government should also provide additional incentives to ensure that we do not miss the opportunity. To ensure this to happen we must create a conducive environment by creating necessary infrastructure with emphasis on internet connectivity and bandwidth in both the rural and urban areas which must be made affordable. Despite which people in rural areas will still be facing a shortage of computers and devices to access the online programme. As per the NSSO data, only 10.7 and 23.8 percent of households have had access to computers and internet connectivity respectively in 2017-18. Additionally, well-established institutions especially in the rural areas and also in the universities must strengthen their online platforms to ensure that learners get access to these facilities to use the same for the distance and open learning programmes/degrees on their premises or there be an option of guided online degree programmes. All these efforts, still may not able to significantly contribute to the desire for GER of 50 percent in 2035. The initiatives as indicated above may still be found insufficient because of which tie-up with the big business houses to establish learning centers may also be explored which may be funded through the CSR funds. Like AISHE, a separate MIS may be initiated to develop a sound database exclusively for open and distance learning programmes which must also include all state and private open universities. To see all these to happen, let us wait for 2020-21 & 2021-22 enrolment statistics which is most like to experience a declining trend which is not good to attain a high GER of 50 percent in 2035.
References
All India Survey on Higher Education 2019-20 & Other Years, Department of Higher Education, Ministry of Education, Government of India, New Delhi, released in June 2020.
Can There be Alternative Indicators of Enrolment: A Critical Review of Frequently Used Indicators, Journal of Educational Planning & Administration, July 2002, NIEPA, New Delhi.
Can India Achieve its Enrolment Target Post-pandemic?, Eklovya Jain and Alan Ruby, University World News: The Global Window on Higher Education, 25 July 2020.
Investment Priorities & Cost Analysis: A Study of Upper Primary Education in India (with Dr. N. V. Varghese), Vikas Publishing & NIEPA, New Delhi, 2001.
National Education Policy 2020, Ministry of Human Resource Development, Government of India, New Delhi, July 2020.
NEP 2020: Implementation Strategies, National Institute of Educational Planning and Administration, New Delhi, December 2020.
NSSO 75th Round on Key Indicators of Household, Social Consumption on Education in India, Ministry of Statistics and Programme Implementation, National Statistics office, Government of India, July 2017 to June 2018.
United Nations (2019), Department of Economic and Social Affairs, Population Division: World Population Prospects 2019, accessed on June 3, 2021, from https://population.un.org/wpp/DataQuery/e.
Rashtriya Uchchatar Shiksha Abhiyan: National Higher Education Mission (PDF). Ministry of Human Resource Development. National Informatics Centre. Retrieved 2 February 2014
Technical Group on Population Projections National Commission on Population, Ministry of Health & Family Welfare, Government of India, July 2014.


