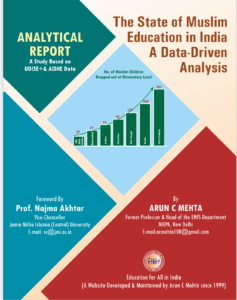

Out-of-School Children in India: A Comparative Analysis of UDISE+ 2024-25 and PLFS 2023-24
By Arun C. Mehta-inspired Analysis | Education for All in India | May 2026
Abstract
Despite significant policy efforts, millions of children and adolescents in India remain outside the formal education system. This article compares administrative estimates from UDISE+ 2024-25 (~46 million children aged 6-17) with household survey data from PLFS 2023-24 (~20.07 million aged 14-18 not attending school). It examines methodological differences, presents state-wise comparisons for major states, clarifies key OOSC concepts, and discusses implications for achieving NEP 2020’s universal secondary education goal and SDG 4 targets.
1. Introduction
Universal school participation is central to India’s equitable development agenda. The Right to Education Act (2009) and National Education Policy (NEP) 2020 aim for 100% Gross Enrolment Ratio (GER) across all school levels by 2030. However, both administrative and survey data reveal persistent exclusion, particularly at secondary stages and in certain states. This analysis reconciles UDISE+ and PLFS data to provide a comprehensive picture.
2. Importance for SDG 4 and NEP 2020
Out-of-School Children (OOSC) directly undermine SDG 4 (inclusive and equitable quality education). NEP 2020 envisions universal access from ages 3-18. High exclusion at secondary levels affects higher education GER targets (50% by 2035) and long-term human capital development. Geographic concentration in a few states amplifies inequities linked to poverty, gender, migration, and infrastructure gaps.
3. Data Sources and Methodology
UDISE+ 2024-25 (Ministry of Education)
School-based administrative data covering 1.47 million schools. Uses Age-Specific Enrolment Ratio (ASER) to estimate OOSC as (100 – ASER) × projected population. Total: ~46 million children aged 6-17 (~17.5% of ~280 million child population).
- 6-10 years: ~19.3 million (16.8%)
- 11-13 years: ~5.2 million (7.3%)
- 14-15 years: ~10.7 million (22.7%)
- 16-17 years: ~10.8 million (22.8%)
PLFS 2023-24 (MoSPI)
Household survey capturing current attendance status. For ages 14-18 “not attending school”: 20,072,909 (~20.07 million).
4. Key Terminological Distinctions
- Never-Enrolled: Never attended any institution (invisible OOSC; best captured by PLFS).
- Dropout: Previously enrolled but left school (tracked in UDISE+ retention rates).
- Out-of-School Children (OOSC): Umbrella term — not currently enrolled in recognised institutions (UDISE+ focus).
- Currently Not Attending: Present non-attendance (PLFS strength; includes irregular attendees).
- Functionally Excluded: Enrolled but rarely attending (fourth category).
5. Major Reasons for Differences between UDISE+ and PLFS
Differences are expected and complementary due to:
- Household survey (PLFS) vs. School records (UDISE+)
- Capture of never-enrolled, migrants, and irregular attendees by PLFS
- Age group focus (14-18 in PLFS vs. detailed bands in UDISE+)
- Enrolment vs. actual attendance measurement
- SDMIS ghost-enrolment cleansing in UDISE+
- Definition of “school” and population projection variances: all enrolment-based indicators, including the age-specific enrolment ratio, are computed based on the projected population (revised projections of MoFW&H), which were derived from the 2011 Census; the next Census figures are expected during 2027-28.
6. State-wise Comparison: Major States (PLFS 2023-24, Ages 14-18)
| State | PLFS OoSC (14-18) | Approx. National Share | UDISE+ Insights (2024-25) |
|---|---|---|---|
| Uttar Pradesh | 47,69,721 | 23.8% | Highest burden; Secondary ASER 68.4%; Very High risk |
| Madhya Pradesh | 19,85,892 | 9.9% | High; significant school rationalisation impact |
| Gujarat | 18,68,315 | 9.3% | Medium-High at secondary level |
| Rajasthan | 17,39,089 | 8.7% | High at secondary; early marriage & geographic barriers |
| Bihar | 14,84,419 | 7.4% | Very High; deep secondary participation gaps |
| West Bengal | 13,07,762 | 6.5% | Notable secondary dropout |
| Maharashtra | 10,38,265 | 5.2% | Medium |
| Odisha | 9,20,129 | 4.6% | Medium, tribal area challenges |
Source: PLFS 2023-24. Grand Total: 20,072,909. UDISE+ insights based on ASER, GER & risk profiles.
7. Policy Implications
- Resolve UDISE+ two-method (All-India vs State-aggregated) discrepancy.
- Integrate SDMS for real-time tracking and household validation.
- Expand secondary schools and transition support in high-burden states (UP, Bihar, MP, Rajasthan, Gujarat).
- Converge education with social protection schemes to address child labour, migration, and poverty.
- Conduct regular block/district-level household surveys for never-enrolled children.
8. Concluding Observations
The ~46 million (UDISE+ 6-17 years) and ~20.07 million (PLFS 14-18 years) figures together highlight the scale of exclusion, especially among adolescents. While UDISE+ provides strong administrative flow data, PLFS better captures ground realities of non-attendance and invisible children. Both sources confirm extreme concentration in a few states and the urgency of secondary-level interventions. Complementary use of these datasets, coupled with transparent data improvements and targeted equity-focused planning, is essential to meet NEP 2020 and SDG 4 goals by 2030.