Muslim Students Transition Rate in India: Cohort 2018-19 to 2020-21
Primary to Upper Primary, Elementary to Secondary & Secondary to Higher Secondary Levels
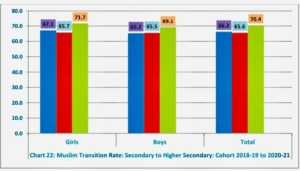
The data presented in Table 27 concerning the transition rate of Muslim enrolment at the all-India level reveals some concerning trends. Irrespective of the educational level, the transition rate for Muslim students is lower than that of all children combined in the latest year, 2021-22. Moreover, there has been a significant decline in the transition rate for Muslim enrolment from 2018-19 to 2021-22, particularly in the transition from primary to upper primary and elementary to secondary levels. However, there has been a slight improvement in the transition rate from secondary to higher secondary level during the same period.
At the all-India level, the transition rate from primary to secondary levels of education stands at 93.2 percent, but for Muslim children, it is lower at 89.28 percent in 2021-22. There is no significant difference between the transition rate of boys (88.61 percent) and girls (89.97 percent) from primary to upper primary levels of education. However, the transition rate for girls is lower than for boys from elementary to secondary levels of education (Girls: 81.38 percent, Boys: 82.57 percent). Conversely, the transition rate is higher for girls than boys from secondary to higher secondary levels of education (Girls: 71.66 percent, Boys: 69.13 percent).
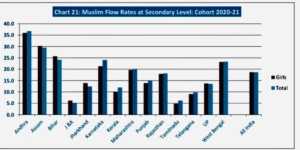
Muslim Flow Rate at Secondary Level, 2020-2
One concerning trend is that the transition rate declines as students move from lower to higher levels of education, and this pattern is observed for both boys and girls. This indicates a lack of continuity and efficiency in the education system, where issues at the primary level hinder the growth of Muslim education at higher levels. The average annual dropout rate for Muslim children at the primary level is 3.48 percent, and about 11 percent of children drop out during the transition, causing significant inefficiency in the system.
While the enrolment ratio for Muslim children may be high, the benefits of increased enrolment will not be fully realized without addressing the dropout and transition rate inefficiencies. In order to improve educational outcomes for Muslim students, particular attention should be given to enhancing the efficiency and effectiveness of the primary education system. Addressing the underlying causes of dropout and implementing targeted interventions can pave the way for a more inclusive and equitable education system that supports the growth and success of Muslim students at all levels of education.
Table 27: Muslim Transition Rate, All India: Cohort 2018-19 to 2020-21
|
Cohort |
Primary to Upper Primary | Elementary to Secondary | Secondary to Higher Secondary | ||||||
| Girls | Boys | Total | Girls | Boys | Total | Girls | Boys | Total | |
| 2018-19 | 95.93 | 93.50 | 94.71 | 90.33 | 90.57 | 90.45 | 67.06 | 65.21 | 66.17 |
| 2019-20 | 90.42 | 88.59 | 89.50 | 85.63 | 84.98 | 85.32 | 65.70 | 65.48 | 65.59 |
| 2020-21 | 89.97 | 88.61 | 89.28 | 81.38 | 82.57 | 81.97 | 71.66 | 69.13 | 70.43 |
Source: Computed based on UDISE data, different years.
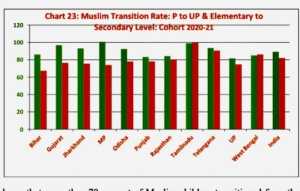
A glance at the state-specific transition rate presented in Table 28 indicates that the transition rate sometimes exceeds 100 in a few states due to the inclusion of all schools, as mentioned previously. Most states boast transition rates above 80 percent from primary to upper primary levels. However, states like Arunachal Pradesh (76.46 percent), Mizoram (59.53 percent), and Manipur (74.19 percent) have notably lower transition rates, posing challenges in achieving universal primary education status. As many as 15 states reported transition rates below 80 percent from elementary to secondary education, with Kerala reporting the highest and Mizoram the lowest at 57.43 percent.
Muslim Transition Rate: Secondary to Hr. Secondary Level,2018-19 to 2020-21
Even in populous states like Bihar, the transition rate from elementary to secondary level is low at 67.32 percent, indicating that about 33 percent of Muslim children could not progress from Grade VIII to IX. The state also experiences a high dropout rate at the elementary level, indicating inefficiencies in the education system. Bihar’s Muslim population share (16.87 percent) is above the national average (14.23 percent), and the high dropout rate may hinder efforts to achieve the goal of universal school education in the state. Additionally, states such as Uttar Pradesh (74.68 percent), Manipur, Mizoram, Meghalaya, Punjab, and Uttarakhand have low transition rates from elementary to secondary education.
Table 28: Transition Rate, Muslim Enrolment, 2021-22 (Cohort 2020-21), All India
|
State/UT |
Primary to Upper Primary | Elementary to Secondary | ||||
| Girls | Boys | Total | Girls | Boys |
Total |
|
| Andaman & Nicobar Islands | 95.75 | 94.02 | 94.82 | 97.71 | 98.07 | 97.89 |
| Andhra Pradesh | 92.10 | 88.41 | 90.18 | 76.72 | 75.24 | 75.96 |
| Arunachal Pradesh | 80.00 | 73.06 | 76.46 | 65.77 | 81.63 | 73.21 |
| Assam | 94.14 | 83.64 | 88.92 | 74.57 | 65.96 | 70.68 |
| Bihar | 86.23 | 85.98 | 86.11 | 66.40 | 68.44 | 67.32 |
| Chandigarh | 105.70 | 108.89 | 107.38 | 95.40 | 95.49 | 95.45 |
| Chhattisgarh | 90.12 | 87.47 | 88.72 | 84.51 | 76.99 | 80.63 |
| Daman & Diu and Dadra & Nagar Haveli | 95.11 | 98.11 | 96.66 | 87.41 | 95.85 | 91.82 |
| Delhi | 99.06 | 94.92 | 96.93 | 94.73 | 94.76 | 94.75 |
| Goa | 94.73 | 94.51 | 94.62 | 89.90 | 91.64 | 90.81 |
| Gujarat | 96.44 | 97.15 | 96.81 | 72.87 | 79.50 | 76.34 |
| Haryana | 99.12 | 97.95 | 98.47 | 82.63 | 88.18 | 85.73 |
| Himachal Pradesh | 104.61 | 104.82 | 104.73 | 88.92 | 88.14 | 88.52 |
| Jammu & Kashmir | 91.36 | 92.75 | 92.07 | 92.33 | 94.45 | 93.42 |
| Jharkhand | 94.60 | 91.61 | 93.10 | 76.97 | 73.84 | 75.51 |
| Karnataka | 97.87 | 97.67 | 97.77 | 96.10 | 96.09 | 96.09 |
| Kerala | 100.00 | 101.65 | 100.84 | 99.49 | 100.84 | 100.18 |
| Ladakh | 91.16 | 90.36 | 90.76 | 94.70 | 95.92 | 95.29 |
| Lakshadweep | 98.35 | 100.41 | 99.38 | 98.91 | 96.89 | 97.87 |
| Madhya Pradesh | 101.66 | 99.68 | 100.66 | 76.02 | 71.66 | 73.85 |
| Maharashtra | 96.85 | 97.82 | 97.34 | 92.45 | 92.35 | 92.40 |
| Manipur | 75.07 | 73.33 | 74.19 | 72.39 | 73.73 | 73.07 |
| Meghalaya | 112.18 | 97.74 | 105.14 | 56.79 | 71.50 | 63.51 |
| Mizoram | 72.06 | 48.78 | 59.33 | 70.27 | 50.00 | 57.43 |
| Nagaland | 92.84 | 84.13 | 88.43 | 84.54 | 81.31 | 82.84 |
| Odisha | 94.09 | 90.87 | 92.44 | 79.55 | 76.28 | 77.92 |
| Puducherry | 99.12 | 94.32 | 96.64 | 94.59 | 102.24 | 98.28 |
| Punjab | 83.25 | 83.26 | 83.25 | 78.30 | 77.87 | 78.07 |
| Rajasthan | 83.82 | 84.69 | 84.29 | 79.94 | 79.99 | 79.97 |
| Sikkim | 95.79 | 81.75 | 87.78 | 80.17 | 82.69 | 81.36 |
| Tamilnadu | 99.32 | 98.67 | 98.98 | 99.55 | 99.42 | 99.48 |
| Telangana | 95.05 | 92.10 | 93.53 | 91.17 | 89.89 | 90.53 |
| Tripura | 91.92 | 86.08 | 89.05 | 87.82 | 84.25 | 86.20 |
| Uttarakhand | 89.12 | 83.77 | 86.31 | 73.92 | 66.58 | 70.21 |
| Uttar Pradesh | 82.54 | 80.72 | 81.61 | 72.68 | 76.67 | 74.68 |
| West Bengal | 84.90 | 85.35 | 85.12 | 84.89 | 87.42 | 86.04 |
| India | 89.97 | 88.61 | 89.28 | 81.38 | 82.57 | 81.97 |
Source: Computed based on UDISE+ data, different years.
These low transition rates in several states signify potential barriers and challenges in ensuring seamless educational progression for Muslim students. Addressing the underlying causes of these low transition rates, such as dropout issues and inefficiencies in the education system, is crucial for achieving universal education goals and fostering inclusive and equitable education for all students, including Muslims. Policymakers and educators must collaborate to implement targeted interventions and improve the educational landscape to facilitate smoother transitions and better educational outcomes for students across states.
Muslim Transition Rate at Primary to Upper Primary Level, Cohort 2020-21
Table 29 shows that more than 70 percent of Muslim children transitioned from the secondary level (Grade X) to the higher secondary level (Grade XI) in the academic year 2020-21. However, specific states reported low to meager transition rates, including Andhra Pradesh (48.36 percent), Assam (56.05 percent), Gujarat (58.95 percent), Maharashtra (63.24 percent), and Odisha (36.43 percent), along with several states from the north-eastern region. This pattern remains consistent for both Muslim boys and girls, and it is also reflected in the overall dropout rate (18.64 percent) and Gross Enrollment Ratio (GER) (43.54 percent) at the secondary level of education.
Table 29: Transition Rate, Muslim Enrolment, 2021-22 (Cohort 2020-21), All India
|
State/UT |
Secondary to Higher Secondary | Grade XI to XII* | ||||
| Girls | Boys | Total | Boys | Girls |
Total |
|
| Andaman & Nicobar Islands | 87.02 | 92.67 | 89.78 | 96.83 | 95.56 | 96.26 |
| Andhra Pradesh | 49.10 | 47.67 | 48.36 | 64.25 | 65.23 | 64.75 |
| Arunachal Pradesh | 73.26 | 67.31 | 70.43 | 94.68 | 100.00 | 97.19 |
| Assam | 52.93 | 60.24 | 56.05 | 96.95 | 91.17 | 94.07 |
| Bihar | 49.84 | 55.28 | 52.34 | 107.50 | 107.44 | 107.47 |
| Chandigarh | 73.65 | 70.14 | 71.75 | 100.37 | 100.34 | 100.35 |
| Chhattisgarh | 86.37 | 81.85 | 84.16 | 93.60 | 98.64 | 95.78 |
| Daman & Diu and Dadra & Nagar Haveli | 64.44 | 73.43 | 69.35 | 90.68 | 87.72 | 89.22 |
| Delhi | 97.05 | 89.93 | 93.62 | 97.18 | 97.16 | 97.17 |
| Goa | 75.30 | 75.36 | 75.33 | 100.00 | 100.12 | 100.05 |
| Gujarat | 63.36 | 55.56 | 58.95 | 97.97 | 99.20 | 98.56 |
| Haryana | 82.67 | 82.04 | 82.26 | 98.93 | 98.93 | 98.93 |
| Himachal Pradesh | 71.19 | 68.60 | 69.69 | 85.14 | 90.55 | 87.97 |
| Jammu & Kashmir | 89.63 | 93.95 | 91.88 | 96.68 | 92.34 | 94.36 |
| Jharkhand | 73.33 | 76.93 | 74.91 | 99.15 | 102.89 | 100.85 |
| Karnataka | 55.24 | 45.18 | 50.16 | 83.61 | 82.03 | 82.90 |
| Kerala | 80.36 | 72.00 | 76.08 | 98.85 | 98.28 | 98.58 |
| Ladakh | 91.42 | 96.54 | 93.88 | 95.98 | 86.82 | 91.72 |
| Lakshadweep | 101.93 | 97.21 | 99.57 | 97.57 | 98.46 | 98.02 |
| Madhya Pradesh | 92.26 | 89.88 | 91.11 | 106.83 | 107.99 | 107.35 |
| Maharashtra | 64.30 | 62.22 | 63.24 | 99.16 | 100.95 | 100.05 |
| Manipur | 61.50 | 74.45 | 67.97 | 63.37 | 78.79 | 71.22 |
| Meghalaya | 57.72 | 63.41 | 60.59 | 111.98 | 124.67 | 118.74 |
| Mizoram | 71.43 | 80.65 | 76.27 | 181.25 | 480.00 | 252.38 |
| Nagaland | 51.53 | 61.07 | 56.32 | 101.63 | 131.62 | 116.25 |
| Odisha | 38.93 | 33.83 | 36.43 | 72.10 | 63.79 | 68.20 |
| Puducherry | 94.77 | 101.81 | 98.09 | 103.01 | 105.06 | 104.03 |
| Punjab | 78.10 | 75.78 | 76.84 | 91.28 | 92.99 | 92.16 |
| Rajasthan | 72.10 | 71.94 | 72.01 | 95.13 | 94.79 | 94.94 |
| Sikkim | 122.99 | 76.14 | 99.43 | 136.25 | 86.30 | 112.42 |
| Tamilnadu | 89.65 | 84.11 | 86.81 | 101.04 | 101.01 | 101.02 |
| Telangana | 75.67 | 73.08 | 74.37 | 103.34 | 101.54 | 102.44 |
| Tripura | 79.03 | 87.76 | 82.76 | 87.78 | 90.74 | 89.18 |
| Uttarakhand | 76.79 | 69.22 | 73.11 | 98.91 | 100.41 | 99.58 |
| Uttar Pradesh | 73.85 | 72.90 | 73.35 | 98.98 | 99.77 | 99.38 |
| West Bengal | 83.19 | 75.93 | 80.42 | 90.87 | 86.13 | 88.97 |
| India | 71.66 | 69.13 | 70.43 | 96.11 | 95.55 | 95.84 |
Source: Computed based on UDISE+ data, different years. *without considering repeaters.
Table 30 reveals that in 18 states (50 percent), Muslim students’ transition rate from elementary to secondary education is above 85 percent, compared to 30 such states (83 percent) for the transition rate from primary to upper primary level. However, it is observed that once a Muslim child reaches Grade XI, the chances of them reaching Grade XII are relatively brighter.
The key challenges must be addressed to ensure more Muslim children reach Grade XI and beyond. These include enrolling all remaining Muslim children currently out of the education system, checking the dropout rate at the primary and elementary levels, and improving the overall transition rate. We can expect a significant increase in Muslim children progressing to Grade XI and beyond through concerted efforts in these areas.
|
Table 30: Number of States having Muslim Transition Rate: 2020-21 |
||
|
Transition Rate |
Primary to Upper Primary Level |
Elementary to Secondary Level |
| Less than 75% | 2 | 9 |
| 75-85 | 4 | 9 |
| 85-95 | 16 | 10 |
| 95-100 | 9 | 7 |
| More than 100% | 5 | 1 |
| Number of States | 36 | 36 |
Muslim Gross Enrolment Ratio at School Education in India (2021-22)
State-wise Muslim Gross Enrolment Ratio at School Education in India (2021-22)
Muslims Gross Enrolment Ratio at Higher Education Level (2020-21)
Muslim Gender Parity Index at Higher Education Level in India, 2016-17 to 2020-21
Average Annual Growth Rate: Muslim Enrolment in Higher Education
Share of Muslim Enrolment in Higher Education in India: 2016-17 to 2020-21
Number of Muslim Children Dropped-out between 2020-21 & 2021-22 in India


