State-wise Muslim Gross Enrolment Ratio at School Education in India (2021-22)
c) State-specific Muslim Enrolment Ratio
Education plays a crucial role in societal development, and ensuring equal access to quality education for all is a fundamental goal. The state-specific analysis of the Muslim Gross Enrolment Ratio (GER) presented in Tables 19 & 20 provides valuable insights into the state of development of school education for Muslim children in different States & Union Territories in India. Here are some key observations from the analysis:
- Disparities Across Levels: The analysis indicates that states are at different stages of development in school education. Some states show higher Muslim GER at the primary level, with a possibility of achieving near-universal enrolment with a little push. However, the same is not valid for secondary and higher secondary levels of education, where enrolment rates drop significantly.
- Elementary Level GER: About 28 states/UTs have GER above 80 percent at the elementary level (Grades I-VIII) for Muslim children, which suggests relatively higher enrolment rates in these states’ primary and upper primary levels.
- Secondary & Higher Secondary GER: In contrast, only 12 states have GER above 80 percent for Muslim children at the secondary level (Grades IX-X), and only six states have GER above 80 percent at the higher secondary level (Grades XI-XII), which indicates lower participation rates at the secondary and higher secondary levels of education for Muslim children.
- Census Data & Projections: The GER calculated in the present analysis is based on estimated child population figures. Once more recent data from the 2021 Census becomes available; the enrolment ratios may be subject to change. Using projected figures can lead to unconvincing results in some states.
- Lowest GER: The state of Mizoram shows the lowest GER of 33 percent (Grades I-XII) in 2021-22, indicating significant challenges in ensuring enrolment and access to education for Muslim children. However, the state had the lowest 1.35 percent share of Muslim to total population in 2011. Efforts should be made to address this situation.
- Muslim-Majority States: In Muslim-majority states like Assam, Jammu and Kashmir, Lakshadweep, Uttar Pradesh, and West Bengal, the overall enrolment ratio for Muslim students is 107.02, 71.44, 55.18, 68.47, and 114.24 percent, respectively. These states must continue to provide inclusive and quality education to all Muslim children.
- Bihar and Madhya Pradesh: Bihar and Madhya Pradesh have relatively low overall Muslim GER, at 68.51 percent and 61.49 percent, respectively, which indicates that many Muslim children in these states are still out of the education system. Identifying and enrolling out-of-school children in age-appropriate grades should be a priority.
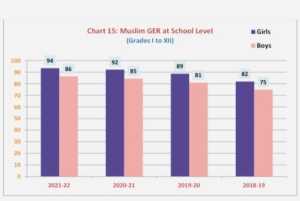
Muslim Gross Enrolment Ratio at School Leve:l 2018-19 to 2021-22
Overall, the analysis highlights the need for targeted efforts in various states and regions to improve enrolment rates and ensure equal access to education for all Muslim children. It underscores the importance of addressing disparities across different levels of education to achieve the goal of inclusive and quality education throughout the country. Policymakers and education authorities should use this data to develop strategies to bridge the gaps and provide equitable opportunities for all children, irrespective of their background or religion.
Muslim Gross Enrolment Ratio at School Education in India (All India 2021-22)
The detailed analysis of the Gross Enrolment Ratio (GER) for Muslim students across primary, upper primary, elementary, secondary, and higher secondary levels in specific states provides valuable insights into the enrolment patterns and challenges these states face in ensuring access to quality education. Here are the key findings from the analysis:
- Primary Level: Assam stands out as a positive example, with a commendable GER of 153.17 at the primary level, including over-age and under-age children, indicating that both girls and boys have good access to primary education. Bihar, with a GER of 93.02, is trying to bridge the gender gap, as girls outperform boys with a GER of 96.67. Jammu & Kashmir showcases a relatively balanced GER of 106.10, ensuring access to primary education for both genders. Though small, Lakshadweep UT demonstrates a reasonably balanced enrollment pattern with a GER of 82.08.
- Upper Primary Level: Assam, Bihar, Jammu & Kashmir face challenges in achieving equal enrollment at the upper primary level. Assam’s GER of 112.76 indicates disparities between girls (123.57) and boys (102.31). Bihar’s GER of 74.01 shows girls (79.25) outpacing boys (68.92). Jammu & Kashmir’s GER drops to 59.23, revealing a need to address lower enrollment among boys. Lakshadweep maintains a reasonably balanced GER of 65.54.
- Elementary Level: The analysis continues to reveal disparities between girls and boys regarding GER at the elementary level (Grades I-VIII) for Assam and Jammu & Kashmir. Assam’s overall GER is 137.12, with girls (144.06) having higher enrollment than boys (130.63). Jammu & Kashmir’s GER stands at 84.01, with girls (87.17) surpassing boys (81.21). Bihar’s overall GER of 85.82 indicates efforts to bridge gender gaps and provide equitable access to education. Lakshadweep maintains a balanced GER of 75.54.
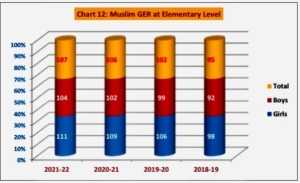
Muslim GER at Elementary Level, 2018-19 to 2021-22
Table 19: State-specific Muslim Gross Enrolment Ratio at Elementary Level: 2021-22, All India
| State/UT | Primary: Grades I-V | Upper Primary: Grades VI-VIII | Elementary:
Grades I-VIII |
||||||
| Girls | Boys | Total | Girls | Boys | Total | Girls | Boys | Total | |
| A & N
Islands |
79.22 | 75.31 | 77.17 | 76.11 | 75.71 | 75.91 | 78.00 | 75.47 | 76.68 |
| Andhra Pradesh | 85.28 | 84.42 | 84.81 | 71.42 | 71.31 | 71.36 | 79.97 | 79.54 | 79.73 |
| Arunachal Pradesh | 98.06 | 102.51 | 100.35 | 50.41 | 55.18 | 52.82 | 76.89 | 81.91 | 79.45 |
| Assam | 157.96 | 148.75 | 153.17 | 123.57 | 102.31 | 112.76 | 144.06 | 130.63 | 137.12 |
| Bihar | 96.67 | 89.73 | 93.02 | 79.25 | 68.92 | 74.01 | 89.93 | 82.00 | 85.82 |
| Chandigarh | 111.91 | 102.35 | 106.59 | 119.07 | 104.78 | 110.98 | 114.59 | 103.28 | 108.25 |
| Chhattisgarh | 74.61 | 79.48 | 77.08 | 71.09 | 73.44 | 72.33 | 73.33 | 77.31 | 75.36 |
| D & D & D & Diu | 91.14 | 90.50 | 90.80 | 93.58 | 91.38 | 92.40 | 92.04 | 90.83 | 91.39 |
| Delhi | 156.41 | 133.53 | 144.02 | 174.76 | 151.76 | 162.54 | 163.40 | 140.35 | 151.01 |
| Goa | 143.04 | 136.05 | 139.36 | 127.17 | 123.95 | 125.47 | 136.93 | 131.40 | 134.01 |
| Gujarat | 96.62 | 86.86 | 91.33 | 89.16 | 84.95 | 86.92 | 93.82 | 86.16 | 89.70 |
| Haryana | 154.56 | 147.70 | 150.86 | 105.22 | 109.59 | 107.61 | 136.28 | 133.67 | 134.89 |
| Himachal Pradesh | 96.31 | 95.91 | 95.72 | 88.69 | 86.83 | 87.97 | 93.29 | 92.29 | 92.65 |
| Jammu and Kashmir | 107.94 | 104.21 | 106.10 | 62.97 | 56.16 | 59.23 | 87.17 | 81.21 | 84.01 |
| Jharkhand | 104.70 | 98.30 | 101.34 | 91.64 | 83.64 | 87.63 | 99.45 | 92.63 | 95.93 |
| Karnataka | 141.78 | 138.26 | 140.00 | 130.28 | 129.59 | 129.92 | 137.41 | 135.05 | 136.22 |
| Kerala | 146.46 | 147.94 | 147.22 | 136.35 | 137.01 | 136.60 | 142.59 | 143.76 | 143.15 |
| Ladakh | 67.42 | 61.49 | 64.30 | 58.30 | 47.01 | 52.29 | 63.90 | 55.80 | 59.62 |
| Lakshadweep | 83.07 | 81.15 | 82.08 | 59.44 | 72.30 | 65.54 | 73.23 | 77.84 | 75.54 |
| Madhya Pradesh | 74.24 | 71.57 | 72.86 | 76.18 | 71.55 | 73.77 | 74.93 | 71.56 | 73.18 |
| Maharashtra | 137.59 | 124.50 | 130.56 | 120.22 | 113.59 | 116.74 | 130.66 | 120.24 | 125.11 |
| Manipur | 179.31 | 173.17 | 176.10 | 96.70 | 91.21 | 93.87 | 141.99 | 136.65 | 139.22 |
| Meghalaya | 185.69 | 170.21 | 177.73 | 119.86 | 97.55 | 108.54 | 157.03 | 139.04 | 147.84 |
| Mizoram | 63.80 | 53.30 | 58.40 | 24.02 | 21.75 | 22.86 | 46.53 | 39.67 | 43.01 |
| Nagaland | 306.16 | 300.02 | 302.95 | 122.86 | 106.90 | 114.53 | 224.39 | 214.17 | 219.05 |
| Odisha | 90.70 | 90.65 | 90.67 | 85.37 | 80.89 | 83.07 | 88.63 | 86.88 | 87.73 |
| Puducherry | 111.29 | 107.07 | 109.09 | 102.86 | 97.61 | 100.14 | 108.02 | 103.43 | 105.63 |
| Punjab | 155.02 | 154.98 | 155.00 | 135.62 | 127.02 | 130.93 | 147.70 | 144.21 | 145.81 |
| Rajasthan | 114.94 | 112.67 | 113.73 | 82.53 | 87.89 | 85.33 | 102.96 | 103.80 | 103.40 |
| Sikkim | 131.60 | 153.42 | 142.78 | 86.57 | 99.86 | 93.35 | 110.49 | 128.46 | 119.68 |
| Tamil Nadu | 124.25 | 119.12 | 121.57 | 118.62 | 116.95 | 117.77 | 122.09 | 118.31 | 120.13 |
| Telangana | 183.32 | 176.40 | 179.61 | 180.86 | 174.82 | 177.65 | 182.36 | 175.80 | 178.86 |
| Tripura | 160.62 | 156.79 | 158.64 | 109.74 | 95.62 | 102.50 | 137.58 | 129.39 | 133.36 |
| Uttar Pradesh | 94.40 | 88.71 | 91.36 | 73.51 | 68.03 | 70.65 | 86.98 | 81.59 | 84.13 |
| Uttarakhand | 161.90 | 150.62 | 155.94 | 105.46 | 95.14 | 99.97 | 139.07 | 128.85 | 133.65 |
| West Bengal | 145.52 | 141.74 | 143.59 | 126.47 | 117.61 | 121.98 | 137.92 | 132.30 | 135.06 |
| All India | 117.06 | 110.41 | 113.55 | 99.88 | 92.22 | 95.91 | 110.54 | 103.68 | 106.95 |
Note: Projected population of Muslims in different age groups has been obtained based on Expert Committee Projections (Total) by assuming that the 2011 Census share of 14.23 percent of the Muslim to Total population is still valid in 2021.
Secondary Level: At the secondary level (Grades IX-X), Assam demonstrates a GER of 72.61, with girls (85.61) surpassing boys (60.04). Bihar faces challenges in achieving gender parity, with a GER of 45.56 for girls and 40.63 for boys. Jammu & Kashmir’s GER is relatively balanced at 53.89 for girls and 52.35 for boys, and Lakshadweep maintains a reasonably balanced GER of 65.39.
Table 20: State-specific Muslim Gross Enrolment Ratio at Secondary Level: 2021-22, All India
|
State/UT |
Secondary: IX-X | Higher Secondary: XI-XII | Total: I-XII | ||||||
| Girls | Boys | Total | Girls | Boys | Total | Girls | Boys | Total | |
| A & N
Islands |
72.85 | 63.92 | 68.08 | 66.22 | 53.95 | 59.71 | 75.03 | 69.52 | 72.14 |
| Andhra Pradesh | 56.57 | 54.95 | 55.74 | 29.68 | 29.35 | 29.51 | 66.79 | 66.29 | 66.52 |
| Arunachal Pradesh | 42.41 | 44.09 | 43.26 | 35.28 | 30.33 | 32.78 | 62.92 | 65.68 | 64.32 |
| Assam | 85.61 | 60.04 | 72.61 | 31.92 | 27.00 | 29.43 | 114.01 | 100.38 | 107.02 |
| Bihar | 50.77 | 40.63 | 45.56 | 23.48 | 20.93 | 22.16 | 72.28 | 64.99 | 68.51 |
| Chandigarh | 106.24 | 84.04 | 93.49 | 54.54 | 43.63 | 48.22 | 102.37 | 88.58 | 94.56 |
| Chhattisgarh | 58.80 | 54.66 | 56.70 | 50.09 | 41.76 | 45.86 | 67.02 | 67.67 | 67.35 |
| D & D & D & D | 76.93 | 72.72 | 74.56 | 43.95 | 33.61 | 37.66 | 82.54 | 77.27 | 79.62 |
| Delhi | 139.55 | 119.69 | 128.89 | 110.19 | 81.26 | 94.53 | 149.51 | 126.18 | 136.93 |
| Goa | 107.40 | 101.54 | 104.27 | 87.35 | 81.98 | 84.54 | 123.15 | 117.61 | 120.23 |
| Gujarat | 59.83 | 62.56 | 61.29 | 32.79 | 29.93 | 31.25 | 77.57 | 72.60 | 74.91 |
| Haryana | 62.58 | 75.46 | 69.62 | 29.38 | 44.75 | 37.77 | 105.31 | 108.55 | 107.10 |
| Himachal Pradesh | 72.06 | 71.75 | 71.90 | 45.60 | 51.16 | 48.55 | 80.99 | 81.22 | 81.05 |
| Jammu and Kashmir | 55.68 | 52.35 | 53.89 | 47.56 | 46.64 | 47.07 | 73.91 | 69.27 | 71.44 |
| Jharkhand | 62.83 | 50.95 | 56.79 | 34.95 | 28.23 | 31.52 | 81.79 | 74.41 | 78.00 |
| Karnataka | 113.78 | 107.76 | 110.69 | 51.53 | 39.48 | 45.30 | 118.50 | 113.93 | 116.15 |
| Kerala | 130.44 | 131.85 | 131.29 | 99.68 | 87.97 | 93.70 | 133.19 | 132.18 | 132.67 |
| Ladakh | 53.88 | 44.87 | 49.22 | 49.44 | 40.79 | 44.99 | 59.48 | 51.27 | 55.18 |
| Lakshadweep | 63.90 | 66.79 | 65.39 | 62.05 | 67.05 | 64.46 | 69.61 | 74.02 | 71.82 |
| Madhya Pradesh | 48.10 | 41.75 | 44.82 | 33.70 | 27.10 | 30.27 | 63.77 | 59.39 | 61.49 |
| Maharashtra | 102.98 | 96.36 | 99.48 | 62.14 | 55.44 | 58.61 | 113.57 | 104.59 | 108.80 |
| Manipur | 74.78 | 74.05 | 74.41 | 48.48 | 59.19 | 53.88 | 111.63 | 110.94 | 111.27 |
| Meghalaya | 61.21 | 61.10 | 61.16 | 30.11 | 34.18 | 32.18 | 117.21 | 106.64 | 111.82 |
| Mizoram | 16.00 | 17.64 | 16.84 | 16.11 | 15.49 | 15.79 | 35.18 | 31.13 | 33.11 |
| Nagaland | 72.61 | 70.56 | 71.54 | 24.39 | 28.06 | 26.27 | 157.60 | 152.64 | 155.02 |
| Odisha | 76.30 | 68.71 | 72.37 | 31.91 | 24.53 | 28.12 | 76.46 | 72.83 | 74.58 |
| Puducherry | 97.23 | 85.24 | 90.88 | 86.41 | 78.48 | 82.29 | 102.46 | 95.98 | 99.08 |
| Punjab | 100.97 | 94.12 | 97.22 | 75.56 | 69.28 | 72.18 | 126.68 | 121.58 | 123.93 |
| Rajasthan | 53.79 | 60.47 | 57.28 | 35.30 | 42.57 | 39.12 | 83.27 | 86.51 | 84.99 |
| Sikkim | 83.77 | 79.61 | 81.66 | 98.07 | 58.53 | 78.03 | 102.73 | 104.79 | 103.78 |
| Tamil Nadu | 113.33 | 110.85 | 112.06 | 92.31 | 84.75 | 88.46 | 115.36 | 111.25 | 113.24 |
| Telangana | 157.33 | 145.99 | 151.49 | 108.60 | 100.43 | 104.31 | 164.46 | 157.07 | 160.55 |
| Tripura | 103.03 | 76.47 | 89.40 | 50.35 | 40.11 | 45.00 | 114.03 | 101.71 | 107.67 |
| Uttar Pradesh | 45.85 | 44.89 | 45.35 | 30.72 | 29.26 | 29.95 | 70.50 | 66.66 | 68.47 |
| Uttarakhand | 67.37 | 54.95 | 60.63 | 47.18 | 34.93 | 40.68 | 109.10 | 98.77 | 103.56 |
| West Bengal | 103.27 | 80.73 | 91.79 | 80.63 | 45.42 | 62.64 | 121.35 | 107.43 | 114.24 |
| India | 74.78 | 66.56 | 70.51 | 47.71 | 39.71 | 43.54 | 93.54 | 86.38 | 89.80 |
Note: Projected population of Muslims in different age groups has been obtained on the basis of Expert Committee Projections (Total) by assuming that the 2011 Census share of 14.23 percent of the Muslim to Total population is still valid in 2021.
Higher Secondary Level: At the higher secondary level (Grades XI-XII), Assam, Bihar, and Jammu & Kashmir continue to experience gender disparities in GER. Assam’s GER is 29.43, with girls (31.92) exhibiting higher enrollment than boys (27.00). Bihar’s GER of 22.16 shows girls (23.48) outperforming boys (20.93). Jammu & Kashmir’s GER is relatively balanced at 47.07 for girls and 46.64 for boys, and Lakshadweep maintains a reasonably balanced GER of 64.46.
Overall, this comprehensive analysis reveals varying enrollment patterns and disparities at different levels of education for Muslim students in specific states. Assam’s efforts towards inclusive education, Bihar’s focus on bridging gender gaps, Jammu & Kashmir’s relatively balanced enrollment, and Lakshadweep’s emphasis on equitable access provide valuable examples for other states. Addressing these disparities and challenges can help build a more inclusive and quality education system for the Muslim community in India. It underscores the need for continued efforts to ensure equal access, regardless of gender or socio-economic background, to achieve the goal of universal and inclusive education.


