Current Educational News of Importance

Under News, we presents issues which are currently of importance, keep watcing this space for current issues.

India’s School Teachers Cross the 1 Crore Mark: What It Means for Quality Education


India’s School Teachers Cross the 1 Crore Mark: What It Means for Quality Education


Introduction

In a landmark achievement for India’s education sector, the total number of school teachers has surpassed the 1 crore (10 million) mark for the first time in the academic year 2024-25. According to the latest Unified District Information System for Education Plus (UDISE+) report released by the Ministry of Education on August 28, 2025, the country now boasts 1,01,22,420 teachers across over 14.71 lakh schools, serving approximately 23.29 crore (233 million) students. This represents a 6.7% increase from 94,83,294 teachers in 2022-23, marking steady progress in teacher recruitment and deployment. In 2023-24, India had a work fore of 8,07,600 teachers.

The UDISE+ platform, which Prof. Arun C Mehta helped nurture into official statistics over 15 years at NIEPA, provides real-time data on school education. This milestone aligns with the National Education Policy (NEP) 2020’s vision of equitable, high-quality education, emphasizing teachers as the “heart of the learning process.” However, as detailed in my UDISE+ 2024-25 analysis on Education for All in India, challenges like contractual hiring, uneven deployment, and post-NAS follow-ups must be addressed for true quality gains. This article explores the data, implications, and roadmap forward.


The Road to 1 Crore Teachers: Key Statistics and Trends

The UDISE+ 2024-25 report highlights robust growth under Samagra Shiksha, with 48.7 lakh teachers at secondary and higher secondary levels, 28.9 lakh at middle, and 23.7 lakh at foundational/preparatory stages. Single-teacher schools dropped 6% to 1,04,125, and zero-enrolment schools fell 38% to 7,993.

Yet, as Geeta Kingdon’s seminal work argues, the perceived shortage of about one million teachers in public elementary schools – based on 2019-20 data – may be overstated due to deployment inefficiencies rather than absolute numbers. Her analysis, hosted on Education for All in India website, reveals fiscal costs of over-hiring in some areas while vacancies persist elsewhere.

The table below summarizes total teacher trends based on UDISEPlus data:

Year Total Teachers (Lakh) % Increase YoY
2014-15 84.50
2018-19 97.00 14.79
2020-21 96.96 – 0.04
2021-22 95.07 – 1.95
2022-23 94.83 -0.5
2023-24 98.08 3.4
2024-25 101.22 3.2

The Rising Role of Female Teachers: Trends and Importance

Female teachers now comprise 54.2% of the workforce, up from 52.3% in 2022-23 and a significant rise from 46.9% in 2014-15. This gender balance is vital: research shows female educators enhance girls’ enrolment and retention by serving as role models, fostering safe environments, and improving attendance – key to NEP 2020’s equity goals. In states with higher female representation, girls’ GER rises by up to 5-7%.

The chart below illustrates the upward trend in female teacher percentage:


This progress, driven by targeted recruitment, must continue to address rural-urban gaps where female teachers remain underrepresented.


Challenges: Contractual Teachers, Deployment Issues, and Quality Concerns

While numbers grow, quality lags due to the proliferation of contractual teachers—often 30-40% of the workforce in states like Uttar Pradesh and Bihar. These educators receive low salaries (₹5,000-15,000/month vs. ₹30,000+ for regulars), fewer benefits, and limited training, leading to high turnover (up to 20% annually) and motivation deficits.  This impacts learning outcomes, as contractual hires correlate with 10-15% lower student performance in foundational skills.

Deployment remains a core issue: Despite 1 crore teachers, shortages persist in rural/tribal areas (PTR >30:1 in Bihar), while urban surpluses and anomalies like 308 teachers in 270 zero-enrolment Karnataka schools highlight misallocation.  UDISE+ data urges rationalization under Samagra Shiksha to optimize distribution.

Post-NAS 2021 (revealing 40-50% competency gaps in Classes 3/5/8), follow-up activities include NISHTHA training for 50 lakh teachers on remedial pedagogies, state-level action plans for weak domains (e.g., math/language), and integration with NEP’s continuous professional development.  Yet, only 75% teachers are professionally qualified, underscoring the need for sustained capacity building.


Improving Pupil-Teacher Ratios and Regional Insights

PTRs improved to 10:1 (foundational), 13:1 (preparatory), 17:1 (middle), and 21:1 (secondary), below NEP’s 25-30:1 norms. States like Odisha (97% retention) lead, but UP’s 9,508 single-teacher schools serve 6.2 lakh students inefficiently.


Conclusion: Toward NEP 2020’s Vision

Crossing 1 crore teachers is transformative, but equitable deployment, regularizing contractual roles, and robust post-NAS training are essential for quality. As per my analyses on Education for All in India, increased funding to 6% GDP will realize universal education by 2030. Download the full UDISE+ report here.

Prof. Arun C. Mehta, Former Professor, National Institute of Educational Planning and Administration (NIEPA), New Delhi

Posted on September 12, 2025 | Tags: UDISE+, School Teachers, Female Teachers, Contractual Teachers, NAS Follow-up, NEP 2020, Samagra Shiksha

Enrolment Crisis: Why School Enrolment Hit a 7-Year Low in UDISE+ 2024-25


Enrolment Crisis: Why School Enrolment Hit a 7-Year Low in UDISE+ 2024-25

Introduction

India’s commitment to universal school education, enshrined in the Right to Education (RTE) Act 2009, faces a critical challenge as the Unified District Information System for Education Plus (UDISE+) 2024-25 report, released on August 28, 2025, reveals a sharp decline in enrolment. Total enrolment across Classes 1-12 has fallen to 232.89 million – a drop of 2.08 million from 234.97 million in 2023-24, marking the lowest level since 2017-18’s 250.99 million. Over seven years, enrolment has contracted by 16.03 million (6.4%), with primary levels (Classes 1-5) declining by 17.46 million since 2021-22. During 2023-24 to 2024-25, primary enrolment declined by 3.5 million (3.21%) and that of elementary level (classes 1 to 8) by 2.89 million but upper primary enrolment increased by 0.57 million (0.90%)

As a pioneer in developing India’s Educational Management Information System (EMIS) and UDISE, analysis of Prof. Arun C Mehta, hosted on Education for All in India, frames this “enrolment crisis” as a convergence of demographic transitions, enhanced data accuracy, and post-COVID reversals. Despite progress in dropout rates and infrastructure under Samagra Shiksha, this decline threatens the National Education Policy (NEP) 2020’s goal of 100% Gross Enrolment Ratio (GER) by 2030. This post, supported by a chart and table, dissects trends, causes, regional variations, and policy imperatives to steer India toward universal schooling.

The Alarming Data: A Seven-Year Downward Trajectory

The UDISE+ 2024-25 report, covering 14.71 lakh schools, confirms a persistent enrolment decline since the 2021-22 peak of 255.74 million. Primary enrolment (Classes 1-5) fell to 104.38 million, down 3.46 million from 2023-24 and 17.46 million (14.33%) since 2021-22. Upper primary (Classes 6-8) and secondary (Classes 9-12) stages saw modest gains, but foundational levels – central to NEP 2020’s early childhood focus – face severe contraction.

The table below, sourced from UDISE+ data and analysis presented on educationforallinindia.com, illustrates the 7-year trend:

Year Total Enrolment (Million) Primary Enrolment (Million) Change from Previous Year (Million) GER – Elementary (%)
2017-18 250.99 121.84 93.2
2018-19 248.87 120.50 -2.12 92.8
2019-20 246.12 118.92 -2.75 92.1
2021-22 255.74 121.84 +9.62 109.66
2022-23 241.62 112,42 -7.42 99.6
2023-24 234.97 107.84 -8.92 96.3
2024-25 232.89 104.38 -2.08 90.6

The chart below visualizes these trends, highlighting the post-2021 reversal:


The table and chart, aligned with UDISE+ data, show a temporary 2021-22 spike (post-COVID government school influx) followed by steep declines. GER at elementary levels stagnated at 90.6% in 2024-25, down from 93.0% primary GER in 2023-24 to 90.9%. Dropout rates improved – primary at 0.8% (from 1.9%), upper primary at 4.1% (from 5.2%), and secondary at 13.3% (from 14.1%) – but absolute dropouts remain high at 4.27 million in secondary. Retention rates rose to 92.4% at primary but fell to 62.9% at secondary, signalling transition bottlenecks.

Unravelling the Causes: Demographics, Data Refinements, and Systemic Shifts

The enrolment decline, as detailed in my UDISE+ 2024-25 analysis, stems from multiple factors:

  1. Demographic Transition: India’s total fertility rate (TFR) has dropped to 2.0, reducing the school-age cohort (6-14 years) by 1-2% annually. This is evident in a 25-lakh drop in ages 3-11 enrolment (from 120.90 million to 118.41 million).
  2. Data Accuracy: UDISE+ enhancements since 2022-23, including 89.4% Aadhaar seeding and student-level tracking, eliminated duplicates, accounting for part of the 2022-23 drop (14.12 million). The 2024-25 decline of 2.08 million reflects genuine losses, as verified in previous computations.
  3. Post-COVID Reversal: Lockdowns drove temporary government school enrolment surges, but post-recovery, families shifted to private unaided schools (up 4.82 million to 85.70 million, 36.8% share). Government schools, comprising 69% of institutions, hold only 50.83% enrolment (118.38 million, down 22.12 million from 2021-22).
  4. School Closures: Since 2017-18, 87,430 schools (mostly government) closed, with 20.6% of schools now having fewer than 30 students. Budget constraints (3.5% of GDP) exacerbate access issues, especially in rural areas.
  5. Quality Perceptions: Learning deficits – 40% of Class III unable to read short stories (ASER) – and inconsistent PM-POSHAN coverage (e.g., Delhi at 60-69%) deter retention. Marginalized groups (SC/ST/OBC enrolment down over 8 lakh) are shifting to private options or home-schooling.

State-Wise Variations: A Mosaic of Resilience and Vulnerability

Enrolment patterns vary across states, as detailed  state-wise breakdowns on Education for All in India. High-fertility states like Bihar and Uttar Pradesh show resilience, with UP reporting zero primary dropouts but a 3% upper primary rate. Southern states like Karnataka and Tamil Nadu face declines across levels, while Odisha’s enrolment fell by 1.13 lakh alongside a reduction to 61,565 schools.

North-eastern and tribal regions, such as Ladakh (high single-teacher schools) and Assam (17.5% secondary dropout), struggle with access and high pupil-teacher ratios (PTRs >30:1). The Ministry’s directive for 23 States/UTs to submit remedial plans  underscores possible gaps in PM-POSHAN implementation.

Implications for Quality Education and NEP 2020 Ambitions

The 7-year enrolment low jeopardizes NEP 2020’s goal of universal access by 2030. Shrinking cohorts strain Samagra Shiksha’s ₹37,010 crore budget, with small schools (75 thousand with <10 students) demanding mergers. Positives include girls’ enrolment at 48.4% and infrastructure gains (93.6% electrification, 63.5% internet), but rural-urban divides and learning crises (50% Class III unable to recognize shapes) persist. This risks a “lost generation” and undermines India’s skill dividend, as I’ve noted in my NEP 2020 indicator analyses.

Conclusion: A Data-Driven Path to Recovery

The UDISE+ 2024-25 enrolment crisis demands urgent action. By addressing demographic realities with targeted policies – bolstering ECCE, preventing school closures, enhancing PM-POSHAN, and raising education spending to 6% of GDP – India can reverse the decline. As chronicled on Education for All in India since 1999, UDISE+ is a roadmap for inclusive education.

Download my full UDISE+ 2024-25 analysis here for actionable strategies.

Prof. Arun C. Mehta, National Institute of Educational Planning and Administration (NIEPA), New Delhi

Posted on September 12, 2025 | Tags: UDISE+, Enrolment Trends, NEP 2020, Samagra Shiksha

Supreme Court’s TET Mandate

Supreme Court’s TET Mandate: Balancing Teacher Accountability and Educational Quality

Supreme Court ruling throws 1 lakh primary school teachers into crisis

Introduction

The Supreme Court’s September 1, 2025, ruling mandating the Teacher Eligibility Test (TET) for all in-service primary and upper primary teachers (Classes 1-8) in non-minority institutions, except those with less than five years until retirement, affects ~20-30 lakh teachers, including 1 lakh in Karnataka. Education for All in India, led by Prof. Arun C. Mehta, evaluates whether low TET pass rates excuse teachers, assigns shared responsibility, addresses job ineligibility risks post-termination, and proposes equitable solutions to uphold quality education under the Right to Education (RTE) Act, 2009, and NEP 2020.

Can Low TET Pass Rates Excuse Teachers?

TET’s low pass rates (10-20% in states like Karnataka) do not fully excuse teachers, as it’s a legal requirement under RTE to ensure teaching competency. However, systemic barriers—outdated training, theoretical test design, and limited rural coaching—hinder success for pre-2011 hires. Teachers must pursue professional development, but low pass rates reflect state failures in providing support. UDISE+ 2024-25 data shows 12% of teachers (1.2 million) lack professional qualifications, underscoring the challenge.

Response to the Verdict

The ruling strengthens RTE and NEP 2020’s quality focus, addressing low learning outcomes (ASER 2023: 50% of Class 5 students read at Class 2 level). TET ensures pedagogy and subject knowledge, which are vital for 14.89 lakh schools. However, retroactively applying it to pre-2011 teachers, hired under older norms, risks unfairness and shortages (national teacher-pupil ratio: 24:1). The two-year grace period (until 2027) is pragmatic but needs equitable implementation to avoid disrupting 2.1 lakh small schools.

Shared Responsibility

  • Teachers: Must pursue TET, having had over a decade to prepare.
  • State Governments: Equally responsible for post-2011 non-TET hires due to shortages (~10 lakh vacancies) and lax NCTE enforcement, neglecting training via Samagra Shiksha.

Job Ineligibility Risk

Terminated teachers, often aged 40-50, may be ineligible for government jobs due to age limits (35-40 years), risking economic hardship and shortages, impacting rural schools the most.

Implementable Suggestions

To uphold quality without mass terminations:

  1. Free AI-Driven Coaching: Use DIKSHA for tailored TET prep (₹250 crore/year for 20 lakh teachers).
  2. Performance Exemption: Allow veterans (15+ years) to qualify via NAS outcomes or peer reviews.
  3. Increment Freeze: Suspend salary increments for non-TET teachers, funding coaching.
  4. Extend Deadline: Grant 3-year grace period (to 2028) for 15+ year veterans.
  5. Enforce TET: Mandate TET for new hires via UDISE+ tracking.
  6. Reduce Non-Teaching Duties: Reassign survey tasks to non-teachers.

Concluding Observations

The TET mandate advances quality education but risks inequity. Teachers and states share responsibility for qualification gaps. Education for All in India urges states to implement coaching, exemptions, and strict hiring policies, using UDISE+ data to ensure RTE and NEP 2020 goals by 2030.

Suggested Readings

Higher Education Commission of India (HECI) Bill: A Transformative Step for Indian Higher Education

Envisioning Indian School Classrooms in 2035: The Transformative Role of AI and Smart Technologies

Envisioning Indian School Classrooms in 2035: The Transformative Role of AI and Smart Technologies

Committee for Free Education Implementation under the RTE Act, 2009

Committee for Free Education Implementation under the RTE Act, 2009

Andhra Pradesh to determine Per-Child Expenditure for Students Admitted to Private Schools under the Right to Education Act (2025)


Introduction

The Right of Children to Free and Compulsory Education Act, 2009 (RTE Act), represents a landmark legislation in India that ensures equitable access to education for all children aged 6 to 14 years. A recent development reported on April 2, 2025, in The Hindu highlights the formation of a State-level committee by the School Education Department in Vijayawada, Andhra Pradesh, tasked with determining the ‘per-child’ expenditure for students admitted to private schools under the RTE Act. This initiative underscores the ongoing efforts to operationalize the Act’s provisions, particularly Section 12(1)(c), which mandates all the private unaided schools to reserve twenty-five percent of their entry-level seats for children from economically weaker and disadvantaged sections, with the government reimbursing the associated costs; the present article provides a detailed analysis of the committee’s formation, historical context, the necessity driving its establishment, the state-wise status of RTE implementation, and the broader significance of the RTE Act.

Historical Perspective

The RTE Act, enacted on August 4, 2009, and effective from April 1, 2010, emerged from decades of advocacy for universal education in India. Rooted in Article 21A of the Constitution of India, inserted via the 86th Amendment in 2002, the Act transformed education from a directive principle into a fundamental right. Historically, the education system in India has been marked by disparities, with access often limited by socio-economic status, caste, and geography. Pre-independence efforts, such as the Wardha Scheme of 1937, and post-independence policies, including the Kothari Commission (1964-66), laid the groundwork for universal education, yet implementation remained uneven.

The RTE Act responded to these persistent gaps, aiming to bridge the divide between public and private education systems. Section 12(1)(c) explicitly addresses the privatization trend by mandating private schools to integrate marginalized children, reflecting a hybrid public-private partnership model. The Vijayawada Committee’s formation in 2025 continues this effort, addressing operational challenges that have persisted since the Act’s inception. Unfortunately, even after about 15 years of RTE implementation, Section 12(1)(c) of the RTE Act 2009 still needs further refinements, which is true not only for Andhra Pradesh but for the rest of the states of India.

Necessity for the Committee

Several factors necessitated the establishment of the State-level committee in Andhra Pradesh:

1 Financial Ambiguity: The RTE Act mandates government reimbursement of private schools for admitting disadvantaged students, but the lack of a standardized ‘per-child’ expenditure formula has led to disputes and delays. The committee aims to resolve this by setting a precise, evidence-based rate.

2 Implementation Gaps: Despite 15 years of the RTE Act, compliance with Section 12(1)(c) remains inconsistent. Private schools often resist admitting students due to financial uncertainties or perceived quality dilution, necessitating a structured oversight mechanism.

3 Regional Disparities: Andhra Pradesh, like many states, faces unique challenges, including a growing private school sector and rural-urban divides. The committee’s diverse composition—government officials, private school representatives, and NGOs—ensures a balanced approach to these issues.

4 Timely Action for 2025-26: With the academic year approaching, immediate assessment of per-child costs is critical to ensure smooth admissions and reimbursements, as stipulated in the G.O. (No. 103) issued on April 1, 2025.

Analysis of the Committee’s Structure and Mandate

The committee, chaired by the Principal Secretary/Special Chief Secretary of School Education, includes key stakeholders: finance and education department officials, private school representatives (e.g., APPUSMA, APPSA, ISMA, UPEIF), and NGOs (e.g., Indus Action, Pratham, UNICEF). This multi-stakeholder approach reflects an intent to balance fiscal responsibility with educational equity.

The mandate involves:

  • Determining Per-Child Expenditure: Assessing costs based on factors like infrastructure, teacher salaries, and operational expenses, to be reviewed annually in December.
  • Reimbursement Mechanism: Facilitating direct transfers via RTGS/NEFT in two instalments (50 percent in September and 50 percent in January), ensuring school financial predictability.
  • Timeline: Immediate action for 2025-26, with meetings every three months initially, then annually.

This structure addresses past criticisms of ad-hoc reimbursements and lack of transparency, potentially setting a model for other states.

State-Wise Status of RTE Section 12(1)(c) Implementation

The implementation of Section 12(1)(c) varies widely across India, reflecting diverse socio-economic and administrative contexts:

  • Andhra Pradesh: In 2024, the Andhra Pradesh State Commission for Protection of Child Rights (SCPCR) reported that 25,125 children were slated for free education under RTE, yet vacancies persist due to non-compliance by some schools. The new committee aims to streamline this process.
  • Tamil Nadu: As of 2024, Tamil Nadu filled approximately 80 percent of its RTE seats, but parents report challenges like hidden fees and lack of awareness, as noted in The Hindu (April 21, 2024).
  • Karnataka: A 2024 survey identified 63 illegally operating private schools, with 294 violating medium-of-instruction norms, indicating enforcement issues despite mandatory RTE registration.
  • Maharashtra: Reports suggest over 50 percent compliance in urban areas like Mumbai, but rural regions lag, with vacancies exceeding 30 percent in some districts.
  • Uttar Pradesh: With a large population and private school network, compliance is below 40 percent, hampered by inadequate monitoring and funding delays.

Nationally, the Annual Status of Education Report (ASER) 2023 estimated that only 20-25 percent of eligible children benefit from Section 12(1)(c), with over 1 million seats remaining vacant annually due to bureaucratic hurdles and resistance from private institutions.

Criteria for Per-Child Expenditure

The committee’s criteria for determining expenditure can be inferred from RTE guidelines and educational economics:

  • Direct Costs: Tuition fees, uniforms, textbooks, and stationery, as mandated under RTE.
  • Indirect Costs: Pro-rata share of infrastructure (classrooms, libraries) and staff salaries.
  • Regional Adjustments: Variations based on urban vs. rural settings and private school fee structures.
  • Quality Standards: Ensuring reimbursements align with minimum learning outcomes, a core RTE goal.

Importance of the RTE Act and Section 12(1)(c)

The RTE Act is a cornerstone of commitment to the United Nations’ Sustainable Development Goal (SDG) 4: Quality Education. Its significance lies in:

  • Equity: Breaking socio-economic barriers by integrating marginalized children into mainstream education.
  • Public-Private Synergy: Leveraging private infrastructure to supplement public schools facing resource constraints.
  • Legal Mandate: Enforcing accountability through judicial oversight, with Supreme Court of India rulings (e.g., Society for the Unaided Private Schools of Rajasthan v. Union of India, 2012) upholding Section 12(1)(c).

Section 12(1)(c) specifically:

  • Targets Disadvantage: Ensures 25 percent reservation for economically weaker sections (EWS) and disadvantaged groups (e.g., SC/ST, OBC, disabled), defined by income (e.g., below ₹2 lakh annually in many states) and social criteria.
  • Shifts Burden: Transfers financial responsibility to the state, reducing out-of-pocket costs for low-income families.
  • Promotes Inclusion: Fosters social cohesion by mixing diverse student cohorts, challenging the elitism of private education.

Critical Analysis

While the committee’s formation is a progressive step, challenges remain:

  • Enforcement: Past resistance from private schools suggests compliance may depend on punitive measures, which the article does not address.
  • Funding: The reliance on state budgets raises concerns about sustainability, especially in economically strained regions.
  • Equity vs. Quality: Integrating EWS students risk stigmatization or resource dilution unless pedagogical support is enhanced.
  • Data Gaps: The lack of real-time, state-wise data on seat utilization hampers effective policy-making, a gap the committee could address through robust monitoring.

Comparatively, states like Tamil Nadu and Karnataka have experimented with online portals for RTE admissions, a potential enhancement for Andhra Pradesh. Globally, models like Brazil’s Bolsa Família, which ties education subsidies to attendance, offer lessons in incentivizing compliance.

Concluding Observations

The Vijayawada committee represents a pragmatic response to operationalizing the RTE Act’s vision of inclusive education. Standardizing per-child expenditure and ensuring timely reimbursements address a critical bottleneck in Section 12(1)(c)’s implementation. However, its success hinges on enforcement, stakeholder cooperation, and sustained funding. Historically, the RTE Act has shifted India’s educational paradigm, yet its full potential remains unrealized due to systemic inequities. This initiative could serve as a blueprint for other states, reinforcing the Act’s transformative promise while highlighting the need for continuous evaluation & adaptation.

Suggested Readings

  • The Hindu. (2025, April 2). “Panel to ensure smooth implementation of free education for poor children in private schools.”
  • Right of Children to Free and Compulsory Education Act, 2009, Government of India.
  • Annual Status of Education Report (ASER), 2023, Pratham Foundation.
  • Society for the Unaided Private Schools of Rajasthan v. Union Government of India, Supreme Court of India, 2012.
  • Ministry of Education, Government of India, RTE Implementation Reports (various years).

Education for All in India

NCERT Module on Internet Addiction (2025)

Review of NCERT  Module on Internet Addiction (2025)

Internet Addiction, Cybercrime, and Computer Use Among Students in India

Introduction

The National Council of Educational Research and Training launched its “Internet Addiction” module on March 28, 2025, to curb excessive Internet use among school students, aligning with the National Education Policy (NEP) 2020.  The digital transformation, driven by affordable smartphones and growing internet access, has revolutionized education in India but introduced risks such as internet addiction and cybercrime. The NCERT module on “Internet Addiction” addresses addiction, yet students also encounter cyber threats and engage with computers in varied ways.

NCERT Module on Internet Addiction 2025

The present article proposes expanding the module to encompass cybercrime awareness, diverse computer use modes, and precautionary measures. The present article advocates a comprehensive curriculum integrating these dimensions, grounded in empirical data and possible solutions. It assesses the revised framework’s scope, relevance across socio-economic contexts using UDISEPlus and NSS Organisation 75th Round data, and its implementation feasibility. Strategies for educating students, parents, and teachers are outlined, supported by references and FAQs for accessibility.

Revised Scope of the NCERT Module

The original module identifies six addiction types: Social networking, Online shopping, Gaming, Online gambling, OTT platforms, and Pornography. However, the present article suggests a few additional areas, as specified below:

1            Cybercrime

  • ◦             Types: Cyberbullying, phishing, hacking, and scams.
  • ◦             Impact: Emotional distress, financial loss, and privacy breaches.
  • ◦             Examples: The 2023 CBSE fake notice scam.

2            Use of Computers in Different Modes

  • ◦             Educational: E-learning platforms (e.g., SWAYAM).
  • ◦             Recreational: Gaming and streaming.
  • ◦             Social: Virtual communication.

◦             Creative: Design and coding tools.

3            Precautions

  • ◦             Technical: Strong passwords, two-factor authentication, and software updates.
  • ◦             Behavioural: Avoiding oversharing and recognizing scams.
  • ◦             Parental Oversight: Monitoring tools and open dialogue.

Critical Analysis: Strengths and Gaps

Strengths: The revised module offers holistic risk coverage, promotes multi-modal literacy, and provides actionable precautions.

Gaps: It lacks depth on AI-driven cybercrime, detailed mode-specific strategies, and full rural applicability.

Relevance Across Contexts: UDISE+ and NSSO Insights

UDISE+ 2023-24 reveals that 50.9 percent of schools have functional computers, and 53.92 percent have internet access. NSSO 75th Round (2017-2018) indicates internet access in 14.9 percent of rural and 42 percent of urban households, with computer ownership at 4.4 percent of rural and 23.4 percent of urban. Digital literacy among 15-to 29-year-olds stands at 24 percent rural versus 56 percent urban. Urban areas require a focus on addiction and cybercrime, while rural regions need access before prevention.

Additional Points

  • Cybercrime Trends: AI scams and legal recourse (IT Act, 2000) [Ref 4].
  • Device Sharing: Risks in low-income households.
  • Offline Safety: Analog scam recognition skills.

Implementation Strategies

1            Curriculum: Integrate into ICT classes with real-world case studies.

2            Teacher Training: Conduct DIKSHA workshops [Ref 5] and provide offline kits.

3            Parental Engagement: Distribute multilingual guides and host PTA sessions.

4            Student Activities: Establish “Cyber Warriors” clubs and use role-playing.

5            Rural Adaptation: Employ radio (PM eVidya)  and mobile vans.

Educating Stakeholders

  • Students: Teach practical skills via apps and “cyber-safety days.”
  • Parents: Guide co-use, scam detection, and balanced behaviour.
  • Teachers: Train in cybersecurity basics and mode management.

Discussion: Relevance and Challenges

The module’s urban relevance is high, given over 50 percent smartphone penetration, but rural access limits its scope (UDISE+, NSSO). Challenges include inadequate infrastructure, low literacy, and cultural resistance.

Recommendations

1            Hybrid Delivery: Combine e-Pathshala [Ref 8] with offline tools.

2            Policy Alignment: Leverage Digital India [Ref 9].

3            Monitoring: Test via pilot programs.

4            Legal Education: Introduce IT Act basics.

Concluding Observations

Enriched with cybercrime, computer use, and precautions, the existing module, if modified, aligns with NEP 2020, preparing students for a secure digital future. Rural adaptation is critical to its nationwide success.

Suggested Readings

1            CBSE Fake Notice Scam (2023): Times of India – Reports on cybercrime targeting students.

2            UDISE+ 2023-24 Report: UDISE+ Dashboard – Data on school infrastructure.

3            NSSO 75th Round (2017-2018): MOSPI Report – Household education and              technology access.

4            Information Technology Act, 2000: MeitY – Legal framework for cybercrime.

5            DIKSHA Platform: DIKSHA Portal – Teacher training initiative.

6            PM eVidya: Ministry of Education – Digital education outreach.

7            ICEA Smartphone Penetration (2022): ICEA Report – Industry data on mobile usage.

8            e-Pathshala: e-Pathshala Portal – NCERT’s digital learning platform.

9            Digital India: Digital India Portal – Government initiative for digital access.

Frequently Asked Questions (FAQs): NCERT 2025 Module on Internet Addiction

1 What is the NCERT module on internet addiction?

◦             Answer: Launched on March 28, 2025, it’s an NCERT tool to help students manage excessive internet use, covering addiction types (e.g., gaming, social media) and offering self-regulation strategies aligned with NEP 2020.

2 Why include cybercrime in the module?

◦ Answer: With 1.5 million cybercrime cases in 2022 (NCRB), students face risks like phishing and hacking. Awareness complements addiction prevention, safeguarding them emotionally and financially.

3 How does the module address different uses of computers?

◦ Answer: It covers educational (e.g., SWAYAM), recreational (e.g., gaming), social (e.g., WhatsApp), and creative (e.g., coding) modes, promoting balanced engagement.

4 What precautions does the revised module suggest?

◦ Answer: It recommends technical measures (e.g., strong passwords, 2FA), behavioral habits (e.g., avoiding oversharing), and parental monitoring (e.g., Google Family Link).

5 Is the module relevant for rural students with limited internet access?

◦ Answer: Partially. Only 24.2 percent of rural schools have internet (UDISE+), reducing addiction risks, but cybercrime education is vital as connectivity grows. Offline methods (e.g., radio) adapt it for rural use.

6 How will teachers be trained to implement this?

◦ Answer: DIKSHA workshops cover addiction, cybercrime, and computer use, with offline kits provided for rural areas.

7 What role do parents play in this curriculum?

◦ Answer: Parents monitor usage, detect scams, and model balance, supported by guides and PTA sessions.

8 Can this module prevent all internet-related issues?

◦ Answer: No, it’s a foundational step. It tackles common risks but requires updates for emerging threats (e.g., AI scams) and broader infrastructure support.

9 How does it align with national policies?

◦ Answer: It supports NEP 2020’s well-being and literacy goals and can utilize Digital India for rural outreach.

10 What are the biggest challenges to its success?

◦ Answer: Rural infrastructure gaps (UDISE+: 26 percent schools with computers), low digital literacy (NSSO: 24 percent rural youth), and cultural resistance to sensitive topics.

Education for All in India

Review of EMIS in Ghana, Cambodia, Iraq, Nepal & Southern-Sudan 2022

Review of EMIS in Ghana, Cambodia, Iraq, Nepal & Southern-Sudan

In view of progress made in India towards strengthening Educational Management Information System in India, a number of countries including Ghana, Sothern Sudan and Cambodia invited Prof. Arun C Mehta, Formally Professor & Head of the Department of EMIS, NIEPA, New Delhi to review their EMIS. Prof. Mehta while at NIEPA, New Delhi visited these countries, had intensive discussions on different aspects of EMIS and presented Mission Report to authorities many  recommendations of which were implemented.

Read  Complete Mission Report here

Under the leadership of Prof. Mehta, DISE-UDISE were developed in India which significantly addressed limitations in the EMIS which later awarded numerous national and regional awards including  e-Governance, eINDIA, Manthan Shttp://www.udise.inouth Asia and EMPI Indian Express Innovation Awards.

Strengthening Educational Management Information System in India through U-DISE(A Story of its Evolution)

e-Book by Arun C Mehta released: FORTY YEARS OF ARUN C MEHTA at NIEPA

e-Book by Arun C Mehta: FORTY YEARS OF ARUN C MEHTA at NIEPA, New Delhi

ABOUT THE AUTHOR
Professor Arun C. Mehta
Professor & Head (Formerly)
Department of Educational Management Information System
NIEPA, New Delhi

Ph.D. (Demographic Projections) from the University of Rajasthan, Jaipur; specialist in EMIS, Quantitative Techniques and Projections and Forecasting of Educational Data; authored books on Education for All in India, Enrolment Projections, Population Projections and Upper Primary Education and contributed a number of research articles in journals and in NUEPA Occasional Paper Series; published a number of reports annually based on DISE data; presented papers both at the Oxford and Cambridge Universities, Consulted by World Bank, UNICEF, UNESCO and ACCU (Japan), Trained at UNESCO Regional Office at Bangkok and Harvard Institute of International Development, USA. Was actively engaged in strengthening of Educational Management Information System in India during 2001 to 2017 (January) at the national level and managed one of the World’s largest information systems i.e. District Information System for Education (DISE/U-DISE).

http://schoolreportcards.in & www.udise.in developed under the guidance of Prof. Mehta is the recipient of e-Governance 2010 & eINDIA 2010 National Awards & Manthan Award South Asia 2010 & EMPI Indian Express Indian Innovation Award 2012.

www.educationforallinindia.com
www.udise.in
www.schoolreportcards.in

e-Book Released: 15th February 2022

The  e-Book, entitled Forty Years of Arun C Mehta at NIEPA: 1980 to 2019 was released  on 15th February 2022 by Prof. N. V. Varghese, Vice-Chancellor, NIEPA, New Delhi. Prof. Varghese highlighted importance of research work done by Prof. Mehta, specially his contributions towards strengthening Educational Management Information System (EMIS) in India through Unified District Information System for Education (U-DISE) in his address.

Prof. Mehta presented details of e-Book in the release function. Prof. G. D. Sharma, Former Head of the Higher Education Department, NIEPA and Prof. Sridhar Srivastava, Joint Director, NCERT, New Delhi reflected on research work  carried out by Prof. Mehta over almost four decades and highlighted importance of self accountability in the academic field.  Shri A. N. Reddy, Assistant Professor, NIEPA made the introductory observations and welcome the guests and briefly introduced the speakers.

Video Recording of Release Function

The Foreword of e-Book  is written  by Prof. Kuldeep Mathur, Former Director, NIEPA.

Late Prof. B. P. Khandelwal (Former Director NIEPA), Prof. P. K. Joshi (Former Director NIEPA & presently Chairman of UPSC), Prof. R. Govinda (Former Vice-Chancellor, NIEPA), Shri Baldev Mahajan (Former Joint Director NIEPA), Prof. Marmar Mukhopadhyay (Former Joint Director, NIEPA), Prof. G. D. Sharma (Former Head of the Higher Education Department, NIEPA), Prof. Najma Akhtar (Former Professor NIEPA & presently Vice-Chancellor, Jamia Milia Islamia University), Mr. Simon Ellis (Former Regional Director UNESCO Institute for Statistics) and Prof. Geeta Gandhi Kingdon, Chair of Education and International Development, University College London have extensively commented on the research undertaken by Prof. Arun C Mehta.

Foreword & Observations on Research  by Prof. Arun C Mehta

Download Full e-Book

Video Recording of Release Function

NIRF 2023: National Institute Ranking Framework

National Institute Ranking Framework (NIRF)2023

Brief Introduction

The National Institutional Ranking Framework is an initiative by the Ministry of Education/HRD, Government of India. It was launched in 2015 to rank higher education institutions in India. The Rankings for the year 2023 was released on June 6th 2023, brief analysis of which is presented in this article. Have a look at it!!

The NIRF rankings are based on several parameters concerning learning, teaching, and resources; research & professional practice; graduation outcomes; outreach and inclusivity; and perception. The rankings are considered a valuable tool for students, parents, and policymakers to compare different universities and institutions in India. The NIRF rankings are released annually and have become a widely accepted benchmark for assessing the quality of higher education institutions in India.

As many as 1,000 institutions have been covered under the NIRF 2023 Rankings, details of which can be seen below in the Table:

Number of Universities & Institutions Covered in NIRF 2023 by Type

Type Number of institutions
Universities 875
Colleges 115
Schools 10
Hospitals 0

The NIRF rankings are an excellent way to compare universities and institutions in India. However, rankings are not the only factor to consider when choosing a university. Other factors, such as the cost of attendance, the location of the university, and the specific programs offered by the university, may also be necessary.

Top-institutions-india-NIRF2023-HT06062023

Top-institutions-india-NIRF2023-HT06062023

top-institutions-india-NIRF2023-HT06062023

Methodology of NIRF

The National Institutional Ranking Framework methodology is developed by the Ministry of Education/Human Resource Development of India to rank higher education institutions in the country. The NIRF rankings are released annually and have become a widely accepted benchmark for assessing the quality of higher education institutions in India.

The NIRF rankings, which are based on a set of objective criteria, are grouped into five broad categories:

  • Teaching, Learning, and Resources (TLR):Through this category, the quality of teaching & learning at the institution level, as well as the availability of resources such as libraries, laboratories, and faculty, is measured.
  • Research and Professional Practices (RPC):This category measures the institution’s research output, as well as its engagement with industry and the community.
  • Graduation Outcomes (GO):This category measures the performance of the institution’s students, as measured by their placement rates, research publications, and awards.
  • Outreach and Inclusivity (OI):This category measures the institution’s efforts to reach underrepresented groups, such as students from rural areas or minority communities.
  • Perception (PER):This category measures the institution’s reputation, as measured by a survey of experts and stakeholders.

Each of these categories is assigned a weight, and the overall ranking of an institution is determined by its score in each category. The NIRF rankings are valuable for students, parents, and policymakers. They can help students make informed decisions about where to study and help policymakers identify areas where improvements are needed in the higher education system.

The NIEF rankings qualitative criteria are further grouped into the following four broad categories:

  • Teaching and Learning (TL)
  • Research and Innovation (RI)
  • Outreach and Connectivity (OC)
  • Governance & Financial Sustainability (GFS)

The key features of the NIRF methodology are summarized below:

  • The NIRF rankings are based on objective criteria designed to be transparent and reproducible.
  • The NIRF rankings are released annually, which allows institutions to track their progress over time.
  • The NIRF rankings are widely accepted by students, parents, and policymakers, which makes them a valuable tool for assessing the quality of higher education institutions in India.

The NIRF rankings have been criticized for being too focused on research & not giving enough weight to teaching and learning. The rankings have also been criticized for being too subjective and not based on complex data. Despite criticisms, the NIRF and the NIEF rankings have become essential tools for students, parents, and policymakers. They can help students make informed decisions about where to study and help policymakers identify areas where improvements are needed in the higher education system.

The NIRF 2023 Rankings

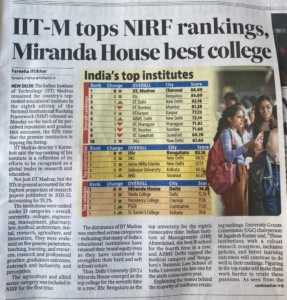
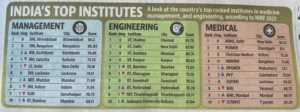
In the NIRF 2023 rankings, overall, the Indian Institute of Technology Madras (IIT Madras) is ranked first, followed by the Indian Institute of Technology Delhi (IIT Delhi) and the Indian Institute of Technology Bombay (IIT Bombay). IIT Madras was ranked first in the engineering category, followed by IIT Delhi and IIT Bombay. In the management category, the Indian Institute of Management Ahmedabad (IIM Ahmedabad) was ranked first, followed by the Indian Institute of Management Bangalore (IIM Bangalore) and the Indian Institute of Management Calcutta (IIM Calcutta).

The Top 15 Institutions: NIRF 2023

A few key findings of the NIRF 2023 rankings are summarized below:

  • The top 100 institutions in the NIRF rankings are concentrated in a few states, such as Delhi, Maharashtra, and Tamil Nadu.
  • The government-funded institutions dominate the NIRF rankings, with private institutions making up a small minority.
  • The NIRF rankings show a wide range of quality among higher education institutions in India.
  • The NIRF rankings can be used to identify institutions performing well and areas where improvements are needed.

Here is the list of the Top 15 institutions based on the NIRF 2023 Rankings:

  1. Indian Institute of Technology Madras (IIT Madras)
  2. Indian Institute of Science (IISc)
  3. Indian Institute of Technology Delhi (IIT Delhi)
  4. Indian Institute of Technology Bombay (IIT Bombay)
  5. Indian Institute of Technology Kanpur (IIT Kanpur)
  6. Indian Institute of Technology Kharagpur (IIT Kharagpur)
  7. Indian Institute of Technology Roorkee (IIT Roorkee)
  8. Indian Institute of Technology Guwahati (IIT Guwahati)
  9. AIIMS: All India Institute of Medical Sciences, New Delhi
  10. Jawaharlal Nehru University (JNU)
  11. Banaras Hindu University (BHU)
  12. University of Delhi
  13. Indian Institute of Technology Hyderabad (IIT Hyderabad)
  14. National Institute of Technology (NIT) Tiruchirappalli
  15. Indian Institute of Technology Indore (IIT Indore)

IITM-tops-NIRF23-HT-06-06-2023

IITM-tops-NIRF23-HT-06-06-2023

Compare NIRF 2022 & NIRF 2023 Rankings

 The National Institutional Ranking Framework (NIRF) and the National Institutional Excellence Framework (NIEF) are two different ranking systems for higher education institutions in India. The NIRF rankings are released annually, while the NIEF rankings are released biennially.

Here is a comparison of the top 10 institutions in the NIRF & NIEF rankings for 2022 & 2023:

Institution NIRF 2022 NIEF 2022 NIRF 2023 NIEF 2023
Indian Institute of Technology Madras 1 1 1 1
Indian Institute of Science 2 2 3 3
Indian Institute of Technology Delhi 3 3 2 2
Indian Institute of Technology Bombay 4 4 4 4
Indian Institute of Technology Kanpur 5 5 5 5
Indian Institute of Technology Kharagpur 6 6 6 6
Indian Institute of Technology Roorkee 7 7 7 7
Indian Institute of Technology Guwahati 8 8 8 8
All India Institute of Medical Sciences 9 9 9 9

The above Table reveals much overlapping between the top 10 institutions in the NIRF and NIEF rankings, suggesting that both ranking systems effectively identify India’s best higher education institutions. There are a few significant differences between the two ranking systems. For example, the Indian Institute of Technology Madras is ranked first in the NIRF rankings, but it is ranked third in the NIEF rankings. This suggests that the NIRF rankings may focus more on research, while the NIEF rankings may focus more on teaching and learning.

Ultimately, the best way to choose a higher education institution is to consider all of the available information, including the NIRF and NIEF rankings. Factors such as the institution’s location, cost, and programs and courses must also be considered while selecting an institution.

The Top 10 Universities: NIRF 2023

The following are the top 10 universities in India as per NIRF 2023:

  • Indian Institute of Science (IISc), Bangalore
  • Jawaharlal Nehru University (JNU), New Delhi
  • Jamia Millia Islamia, Delhi
  • Jadavpur University, Kolkata
  • Banaras Hindu University (BHU), Varanasi
  • Manipal Academy of Higher Education (MAHE), Manipal
  • Amrita Vishwa Vidyapeetham, Coimbatore
  • Vellore Institute of Technology (VIT), Vellore
  • Aligarh Muslim University (AMU), Aligarh
  • University of Hyderabad, Hyderabad

The IISc has been ranked as the country’s top university in the National Institutional Ranking Framework rankings for 2023. The IISc has been ranked first for the sixth consecutive year.

As mentioned above, the NIRF rankings are based on numerous parameters, such as teaching, learning & resources, research & professional practice, graduation outcomes, outreach and inclusivity, and perception. The IISc has been praised for its robust research output, faculty and student quality, and infrastructure. The university has also been credited with playing a pivotal role in developing India’s technological and scientific prowess.

top-collecges-NIRF2023-HT06062023

top-collecges-NIRF2023-HT06062023

top-collecges-NIRF2023-HT06062023

The other universities in the top 10 are also highly regarded for their academic excellence. JNU is known for its humanities and social sciences programs, while Jamia Millia Islamia is a leading university for Islamic studies. Jadavpur University is a premier institution for engineering and science, while BHU is one of India’s oldest and most prestigious universities.

The top 10 universities in India offer a wide range of courses and programs, and they are all committed to providing high-quality education.

Top 10 Engineering Colleges: NIRF 2023 Rankings

  • IIT Madras, Chennai, Tamil Nadu
  • IIT Delhi, New Delhi, Delhi
  • Indian Institute of Technology Bombay, Mumbai, Maharashtra
  • Indian Institute of Technology Kanpur (IIT Kanpur), Kanpur, Uttar Pradesh
  • Indian Institute of Technology Roorkee, Roorkee, Uttarakhand
  • IIT Kharagpur, Kharagpur, West Bengal
  • Indian Institute of Technology Guwahati (IIT Guwahati), Guwahati, Assam
  • Indian Institute of Technology Hyderabad, Hyderabad, Telangana
  • National Institute of Technology Tiruchirappalli (NIT Trichy), Tiruchirappalli, Tamil Nadu
  • Jadavpur University (JU), Kolkata, West Bengal

These colleges are all highly regarded for their academic excellence and research output. They offer a wide range of engineering programs, & graduates produced by them are highly rated and sought-after by employers. When making decisions and selecting an engineering college, it is essential to consider other factors, such as the college’s location, cost, and culture.

NIRF 2022 Vs.NIRF 2023 Rankings

A comparison of the top 15 institutions based on NIRF 2022 and NIRF 2023 ranking is presented below:

Rank Institution NIRF 2022 NIRF 2023 Change
1 Indian Institute of Science 1 1 No change
2 Indian Institute of Technology Bombay 2 2 No change
3 Indian Institute of Technology Delhi 3 3 No change
4 Indian Institute of Technology Madras 4 4 No change
5 Indian Institute of Technology Kharagpur 5 5 No change
6 Indian Institute of Technology Kanpur 6 6 No change
7 Indian Institute of Technology Roorkee 7 7 No change
8 Indian Institute of Technology Guwahati 8 8 No change
9 Indian Institute of Technology Hyderabad 9 10 Down one rank
10 Indian Institute of Technology Banaras Hindu University 10 9 Up one rank
11 University of Delhi 11 11 No change
12 All India Institute of Medical Sciences 12 12 No change
13 National Institute of Technology Tiruchirappalli 13 13 No change
14 National Institute of Technology Durgapur 14 14 No change
15 National Institute of Technology Calicut 15 15 No change

One may observe that there is no major change in the top 15 institutions in the NIRF ranking 2023. The Indian Institute of Science continues to be the top-ranked institution in India, followed by the Indian Institute of Technology Bombay, Delhi, and Madras. The only change in the top 15 is that the Indian Institute of Technology Hyderabad has moved down one rank to 10. In comparison, the Indian Institute of Technology Banaras Hindu University has moved up one rank to 9.

Observations on UDISE+ Report 2021-22

Observations on UDISE+ Report 2021-22, Flash Statistics : Quick Analysis by Prof. Arun C Mehta

Read more

NAS Results Released (25th May 2022)

National Achievement Survey (NAS) 2021  Results Released on 25th May 2022

The @EduMinOfIndia has released the report on National Achievement Survey (NAS) 2021, held on 12.11.2021. Approx. 34 lakh students from government, government-aided and private schools participated in this survey. The report is available on: http://nas.gov.in

National Achievement Survey 2021, National Report, Grades 3, 5, 8, and 10

National Achievement Survey 2021, State Report, Grades 3, 5, 8, and 10

National Achievement Survey 2021, District Report, Grades 3, 5, 8, and 10

  • National, state and district report cards are made available for Class 3, 5, 8 and 10 in language, Social Science, science and mathematics which is not an easy task to analyse.
  • Report cards reveals that many states has lower average marks in 2021 than in 2017, true for all the subjects.
  • 1,18,274 schools, 5,26,824 teachers and 34,01,158 students participated in NAS 21 across grades 3, 5,8 and 10.
  • NAS was conducted on 12 November 2021 across the Country.
  • Out of scaled scores of 500, class 3 has an average score of 323 in language, 306 in mathematics and 307 in EVS
  • Out of scaled scores of 500, class 3 has an average score of 323 in language, 306 in mathematics and 307 in EVS
  • Out of scaled scores of 500, class 8 has an average score of 302 in language, 255 in mathematics, 250 in science and 255 in social science.
  • Out of scaled scores of 500, class 10 has an average score of 260 in MIL, 220 in mathematics, 206 in science, 231 in social science and 277 in English.
  • Many states have lower average scores than the overall average scores
  • 38 percent students faced difficulty in learning at home during COVID, 78 percent it was burdensome, lot of assignments.
  • 24 percent sample students didn’t have digital device at home, 80 percent found learning better in school with peers help.
  • average achievement score in Class 3 in mathematics is 306. In Bihar, Delhi, Himachal Pradesh, Jharkhand, Tamil Nadu, UP, UKD, the same is significantly below that of the overall achievement score.
  • Average achievement score in Class 5 in mathematics is 284. In Bihar, Delhi, Himachal Pradesh, Jharkhand, Tamil Nadu, UP, UKD etc, the same is significantly below that of the overall achievement score. Against which, Assam, Gujarat, Haryana, MP, Punjab, Rajasthan, WB etc have significantly above the overall achievement score.
  • Average achievement score in Class 8 in mathematics is 255. In Andhra, Delhi, Gujarat, Kerala, UP, UKD, the same is significantly below than the overall achievement score. Against which, Bihar, Chandigarh, Haryana, MP, Punjab, Rajasthan etc have significantly above the overall achievement score.
  • Average achievement score in Class 8 in mathematics is 255. In Andhra, Delhi, Gujarat, Kerala, UP, UKD, the same is significantly below than the overall achievement score. Against which, Bihar, Chandigarh, Haryana, MP, Punjab, Rajasthan etc have scores significantly above the overall achievement score

NCERT NAS Reports

NEW DELHI: The National Achievement Survey 2021 was successfully conducted on Thursday. Nearly 96% of the sampled schools and 92% of the targeted sampled children of Classes 3, 5, 8 and 10 from 24 states/UTs participated in the survey.

The results of NAS 2021 will be prepared in the form of district report cards, state/UT reports and national reports. “These NAS report cards will enable states and the Union Territories to identify gaps in learning outcomes and take remedial steps,” as per the ministry of education.

The government conducts the survey every three years. Last NAS was held on November 13, 2017, for assessing the competencies developed by the children of Classes 3, 5 and 8.

This year, NAS 2021 was conducted in 22 mediums of instruction as available in the sampled schools. There are 3 phases of NAS exercise, namely instrument development, sampling design and actual administration of the test.

NAS 2021 is the first achievement survey after the release of National Education Policy 2020 (NEP). NAS 2021 will infuse the competency-based assessment system over the content and memory-based assessment as envisaged by NEP 2020, as per the official statement.

The Covid-19 pandemic forced closure of schools has interrupted the learning in different levels and “there is an urgent need to evaluate children’s progress and learning competencies to analyze and examine the health of the education sector for taking necessary action at the district, state and national level.”

“The assessment focuses not only on cognitive learning but also other skills that children may have picked up, while being at home during the pandemic such as painting, cooking, photography, reading, gardening etc.” it added.

“NCERT, being the nodal academic body, has done the instrument development, testing, finalization of the test items.”

To maintain impartiality, actual administration of the test in the sampled schools was conducted by CBSE in collaboration with states and UTs.

Besides student achievement tests, pupil questionnaires, teachers questionnaires and school questionnaires were also obtained to understand the various settings and perspectives of students, teachers and schools.

These questionnaires were conducted to understand the background, teacher training, rural-urban, effectiveness of online education etc to comprehend the education system.

“It will also help in the capacity building for teachers and officials involved in the delivery of education in the country. The result from the assessment would also provide a rich repository of evidence and data points furthering the scope of research and development,” the official statement read.

Source: News.Careers360

NAS to be Launched Soon by NCERT

Education For All in India wholeheartedly welcome statement of Union Education Minister informing Parliament that National Council of Educational Research and Training will soon conduct the next NATIONAL ACHIEVEMENT SUVRVEY (NAS).

Unlhttp://ncert.ac.inike 2017 NAS, the next NAS will cover both the Private as well as Government schools which is a step in the right direction.

We have been demanding the same for long time to extend the coverage to Private schools.

Most likely the next NAS will be conducted by NCERT in November 2021, the last such survey was conducted  on 13th November 2018 for classes III, V and VIII and for Class X in 2018. It is expected that NAS 2021 will be based on a sample of about 4 million students from across the Country.

Using Data to Improve Teaching and Learning in India: Leveraging Administrative Data for Educational Outcomes

PARAKH Rashtriya Sarvekshan 2024: A Comprehensive Analysis and Its Implications for Educational Landscape in India

PARAKH Rashtriya Sarvekshan 2024 & Follow-up Actions: Suggestions for Improving Future Educational Surveys

50% GER at Higher Education Level in India 2035 Achievable?

50 percent GER at Higher Education in India in 2035 possible?
By Arun C Mehta

Unlike school education level at which enrolment based indicators such as Gross & Net enrolment ratio as well as Age-specific and Adjusted-NER are frequently computed and use in plan formulation, at the higher education level only Gross Enrolment Ratio is being used to examine the participation of a relevant age-specific population i.e. 18 to 23 years in the higher education programmes. In this article, we have examinsed whether  50 percent GER at higher education in India in 2035 is possible?

For calculating GER at any level of education, information on total enrolment in a year and the corresponding age-specific population in that year is required. While total enrolment and its male and female bifurcation, as well as enrolment by the social category i.e. Scheduled Castes & Scheduled Tribes, is available from the All-India Survey on Higher Education (AISHS, latest for 2019-20) but the same is not true for the corresponding age-specific population the main source of which is the Census & Registrar General of India, the latest Census figures being available for the year 2011.

In the absence of an official projected population based on the 2011 Census, earlier projections based on population up to 2001 are being used by the Ministry of Education to estimate the age-specific population in a year which is adjusted given the total 2011 Census population (details can be seen under the Statistics Section of the Official Website of Department of School Education & Literacy).

Because of the limitations in the projected population, GER and other enrolment-based indicators have been seen off the mark in the past decade which is true for all levels of education. Therefore, the latest GER for 2019-20 and also in the past years, the same must be analyzed in light of these limitations.

With 50 percent GER at the higher education level, the quantum increase of enrolment in absolute terms cannot be known unless the reliable estimate of the population between the age-group  18 to 23 years is known in the year 2035. The GER for the year 2021 based on the actual Census 2021 population when available may reveal the real situation concerning the participation of 18 to 23 years population in higher education programmes; it is likely to show a declining trend because of the ongoing pandemic across the country.

Is 50% GER at Higher Education in 2035 Possible (Detailed Analysis by Prof. Arun C Mehta)

NEP 2020

Selected Publications of Prof. Mona Khare on different Aspects of Higher Education in India