
STEM pipelines in India, arthmatic of loss udise and AISHE.
The STEM Pipeline in India, From Science Classrooms to STEM Degrees [PDF]
The STEM Pipeline in India: From Science Classrooms to STEM Degrees
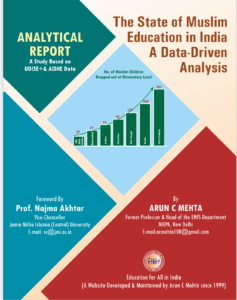
A Data-Driven Analysis based on UDISE+ and AISHE Data by Prof. Arun C. Mehta
Introduction
India is the world’s second-largest producer of STEM graduates, generating approximately 2.55 million annually — yet only 57.1% of its secondary schools have a science laboratory, and barely half of the students who enter Class 11 complete Class 12. This contradiction — impressive volume at the top, fragile and unequal foundations at the bottom — is the central finding of this article.
The STEM Pipeline in India: From Science Classrooms to STEM Degrees is a data-driven analysis by Prof. Arun C. Mehta that traces a student’s journey from secondary school science to a STEM degree in higher education. It is the first study to combine UDISE+ 2024-25 school data and AISHE 2021-22 higher education data into a single connected pipeline analysis, quantifying at each stage how many students are lost, who is disproportionately left behind, and where the most urgent policy repairs are needed.
The article documents a paradox that India’s policy discourse has not yet fully confronted: girls now outnumber boys at the higher secondary level and lead male enrolment in Science at both undergraduate and postgraduate levels — yet female students constitute barely 28.8% of Engineering and Technology enrolment. PhD enrolment has grown 81.2% in seven years, yet India’s R&D expenditure as a share of GDP remains at 0.64%, among the lowest in the world. India ranks 40th on the Global Innovation Index — far below countries that produce fewer STEM graduates but invest more deeply in the research ecosystems that convert graduates into innovators.
The analysis is policy-relevant for researchers, planners, and administrators working on school education, higher education access, gender equity in STEM, and the implementation of India’s NEP 2020.
About the Data
This article is built on two official, nationally comprehensive surveys of Indian education — the only article on this site to combine both into a single pipeline analysis.
UDISE+ 2024-25 (Unified District Information System for Education Plus, 2024-25) is the Ministry of Education’s annual school census, released on 28 August 2025 (PIB PRID 2161543). It covers 14.71 lakh schools, 26.52 crore students, and over 1 crore teachers across all states and union territories. For this article, UDISE+ 2024-25 provides: secondary enrolment (3.72 crore, Classes 9-10); higher secondary enrolment (2.76 crore, Classes 11-12); science laboratory coverage in secondary schools (57.1%); the higher secondary GER (58.4%); the secondary-to-higher-secondary transition rate (75.1%); and the higher secondary retention rate (47.2%). All figures are from the official report and verified against the PIB press release.
AISHE 2021-22 (All India Survey on Higher Education 2021-22) is the Ministry of Education’s comprehensive annual survey of higher education institutions, released on 25 January 2024 (PIB PRID 1999713). It covers 4.33 crore students across all HEIs. For this article, AISHE 2021-22 provides: total STEM enrolment (98.5 lakh, 25.6% of total HE); discipline-wise and gender-wise enrolment at UG, PG, and PhD levels; Engineering and Technology enrolment (34.71 lakh; female 28.8%); Science enrolment at UG (49.18 lakh, female 50.8%) and PG (7.5 lakh, female 61.2%); PhD enrolment by discipline; and HEI infrastructure indicators including laboratory and computer centre availability.
A Methodological Note on Cross-survey Comparisons: UDISE+ 2024-25 covers the school year 2024-25, while AISHE 2021-22 covers July 2021 to June 2022 — a gap of approximately three years. Cross-survey comparisons should therefore be read as indicative of structural trends, not a single-point-in-time snapshot. The transition rate from Class 12 to higher education (estimated at approximately 75-85%) is a cross-survey derived estimate, not an officially published indicator in either survey. All pipeline loss estimates in the article are approximate orders of magnitude and are clearly labelled as such.
Major Findings
- India produces 2.55 million STEM graduates annually — but only 25.6% of higher education students are in STEM. Of 4.33 crore higher education students (AISHE 2021-22), 98.5 lakh (25.6%) are enrolled in STEM disciplines. Three out of every four higher education students in India are in non-STEM disciplines. India’s STEM share of total enrolment is lower than China (40%+) and comparable to UNESCO global norms.
- The STEM pipeline loses approximately 13 out of every 14 students between Class 9 and a STEM degree. Starting from 3.72 crore students in secondary school, the funnel narrows at every stage: 25% are lost at the secondary-to-higher-secondary transition (75.1% transition rate); more than half of those who enter Class 11 do not complete Class 12 (47.2% retention rate); only 25.6% of those who reach higher education choose STEM. The final STEM degree output is approximately 25-30 lakh per year, roughly 1 in 13 to 1 in 14 secondary students.
- The 47.2% higher secondary retention rate is the single most critical bottleneck in the entire STEM pipeline. Of every 100 students who begin Class 11, barely 47 complete Class 12. Combined with the 75.1% transition rate from secondary, the effective completion rate from Class 10 to Class 12 is only about 35.5%; this is the largest single point of loss in the pipeline — larger than any loss at the higher education stage.
- 43% of secondary schools — approximately 2.18 lakh schools — have no integrated science laboratory. According to UDISE+ 2024-25, 57.1% of secondary schools (290,950 out of approximately 509,632) have integrated science labs. Progress has been made — coverage was 53.6% in 2021-22 — but at the current rate of approximately 6,200 new lab-equipped schools per year, universal coverage will take well beyond 2035. Government schools serving SC, ST, and rural students lag most severely.
- Girls now lead boys in Science at both undergraduate and postgraduate levels — but constitute only 28.8% of Engineering and Technology enrolment. In the Science stream at all levels combined, female students (29.8 lakh) outnumber male students (27.4 lakh) — an 8.8% female surplus. At the PG level in Science, 61.2% of students are female. However, in Engineering and Technology, 71.2% of students are male, and only 28.8% are female. Girls who are academically qualified for engineering are systematically channelled toward B.Sc. programmes instead; this is the article’s central gender finding: not a pipeline that excludes girls from STEM, but one that channels them away from its most employment-linked branch.
- PhD enrolment in STEM has grown dramatically — from 1.17 lakh in 2014-15 to 2.12 lakh in 2021-22 (81.2% growth) — but R&D investment remains at 0.64% of GDP. Engineering and Technology leads PhD enrolment with 52,748 students; Science follows with 45,324. Together, these two disciplines account for approximately 46% of all PhDs. Female PhD enrolment doubled in eight years. Nevertheless, India’s GERD of 0.64% of GDP — against a global average of approximately 1.7% and China’s 2.4% — means that STEM PhD graduates have limited research career pathways within India, contributing to brain drain.
- India ranks 40th on the Global Innovation Index (2023) — far below South Korea (10th), China (12th), and Israel (14th). Volume of STEM graduates without commensurate R&D investment and quality research ecosystems does not translate into innovation leadership. Only approximately 5% of STEM students study in premier institutions (IITs, NITs, IISc) where industry-readiness is high; the remaining 95% are distributed across institutions of widely varying quality.
- SC and ST students face a compounded disadvantage in STEM access. ST students have the lowest GER in higher education at 21.2% (compared to a national GER of 28.4%). SC GER is 25.9. ST students are concentrated in districts with the lowest science lab coverage, the lowest higher secondary retention rates, and the fewest engineering colleges. The pipeline problem for marginalised communities begins at the school infrastructure level and compounds at every subsequent stage.
Suggested Readings
The following companion articles on educationforallinindia.com provide the broader context for reading this STEM pipeline analysis. All are directly cross-referenced in the article itself.
- Financing Higher Education in India: Public Commitment, Private Burden, and the 6% Debate
- Financing Higher Education in India, Public Commitment, Private Burden, and the 6% Debate [PDF]
- Higher Education in India at the Crossroad: Analysis based on AISHE 2021-22 Data
- Higher education enrolment and GER projections in 2035 based on AISHE & UDISE data by Arun C Mehta [PDF]
- Education Pipeline in India from Grade 1 to College: How many children make it?

Education for All in India.