Education Policy Analysis · UDISE+ 2025-26
The Size Premium: How Private and Government-Aided Schools Are Reshaping India’s Enrolment Map
A Full State-by-State UDISE+ 2025-26 Analysis of School Counts, Enrolment Shares, and the Structural Forces Behind India’s Shift Toward Private and Aided Education
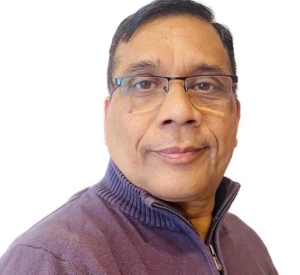
Prof. Arun C. Mehta | Ex. Head, EMIS, NIEPA | educationforallinindia.com
India’s School Education Landscape at a Turning Point
India’s school education system is undergoing one of its most consequential structural transformations. Between 2021-22 and 2025-26, the share of total enrolment in private unaided recognised schools has risen from 31.1% to 38.0% — a gain of roughly 7 percentage points over five years — while the institutional base of these schools has grown only marginally, from 22.6% to 23.3% of all recognised institutions. This shift is driven not primarily by a proliferation of new private schools, but by their consistently larger average size and a sustained parental preference that spans rural and urban areas alike.
The 2025-26 data confirms an important milestone, though a more measured one than headline figures sometimes suggest: government schools’ enrolment share (49.7%) sits just below the halfway mark, while the combined government-and-aided sector accounts for 60.1% of enrolment against private’s 38.0%. The government-aided sector — once a cornerstone of equitable expansion and a bridge between public funding and private management — has continued its long, gradual decline, now standing at 10.5% of enrolment nationally.
The National Education Policy 2020 positioned the strengthening of public education as a central organising principle, envisioning a future in which high-quality government schools become the preferred choice for most Indian families. The UDISE+ record to date shows this aspiration has not yet been realised: enrolment continues to shift toward private providers, and the gap between policy intent and enrolment reality remains a live and important policy question — though, as this analysis shows, the state-by-state picture is considerably more varied than a single national trend line suggests.

| Year | Private (N) | Aided (N) | Total Schools | Private Sch. % | Aided Sch. % | Private Enrol. % | Aided Enrol. % |
|---|---|---|---|---|---|---|---|
| 2021-22 | 3,35,844 | 82,480 | 14,89,115 | 22.6% | 5.5% | 31.1% | 10.0% |
| 2022-23 | 3,23,430 | 81,486 | 14,66,109 | 22.1% | 5.6% | 33.0% | 10.5% |
| 2023-24 | 3,31,108 | 80,313 | 14,71,891 | 22.5% | 5.5% | 38.7% | 10.6% |
| 2024-25 | 3,39,810 | 79,349 | 14,71,473 | 23.1% | 5.4% | 36.8% | 10.5% |
| 2025-26 | 3,41,689 | 79,261 | 14,66,682 | 23.3% | 5.4% | 38.0% | 10.5% |
Source: UDISE+ 2025-26, Table 8.1 (schools) and Tables 5.2–5.5 (I–XII enrolment by management); 2021-22 to 2024-25 from the respective UDISE+ editions for those years.
Private schools reach 38.0% of I–XII enrolment in 2025-26. Private unaided schools — 23.3% of all recognised institutions — educate 38.0% of India’s Class I–XII students. The enrolment-to-institution ratio for private schools stands at 1.63x (38.0% enrolment ÷ 23.3% school share): private schools enrol substantially more students per institution than their numerical presence alone would predict. Government schools’ enrolment share stands at 49.7%, and the aided sector at 10.5%.
Over the five years shown, the institutional share of private schools has grown only marginally (22.6% to 23.3%) while enrolment share has moved more substantially — a pattern consistent across the whole series, even allowing for the likely data discontinuity flagged above between 2022-23 and 2023-24. Whatever the precise magnitude of that mid-series jump, the direction is unambiguous and continues into 2025-26: private schools are capturing enrolment share faster than they are growing in number.
The Aided Sector’s Long, Gradual Decline
Government-aided schools present a contrasting trajectory to private schools. Their share of total institutions has declined from 5.5% in 2021-22 to 5.4% in 2025-26, reflecting both institutional closures and the near-complete cessation of new grants-in-aid in most states. Aided enrolment share has held roughly steady in the 10.0-10.6% band across the five-year series, with 2025-26 at 10.5% — essentially unchanged from 2024-25’s 10.5% and from 2021-22’s 10.0%. This is a materially different picture from a sector in “accelerated decline”: the aided sector’s enrolment share has been broadly stable, even as its institutional count has fallen gradually and its schools have grown somewhat smaller on average. The central policy concern for the aided sector is not a sudden collapse but a slow, multi-decade attrition — schools closing or converting as grants-in-aid dry up, without new aided institutions being created to replace them.
Enrolment by Management: The 2024-25 to 2025-26 Shift
| Management | Enrolment (N) | Share | Schools (N) | Avg. Size |
|---|---|---|---|---|
| Government | 11,53,66,223 | 49.7% | 10,05,245 | 115 |
| Government Aided | 2,42,78,873 | 10.5% | 79,261 | 306 |
| Private Unaided Recognised | 8,82,19,951 | 38.0% | 3,41,689 | 258 |
| Others | 44,41,810 | 1.9% | 40,487 | 110 |
| Total (I–XII) | 23,23,06,857 | 100% | 14,66,682 | 158 |
Source: UDISE+ 2025-26, Table 8.1 and Tables 5.2–5.5. Figures are for Class I–XII; total enrolment including Pre-Primary is 24,72,19,766, of which Government 48.1%, Aided 10.0%, Private 40.0%, Others 2.0%.

One of the most revealing dimensions of India’s ongoing educational transformation is the variation in average school size across management types. In 2025-26, the average private school enrols 258 students — 1.63 times the national all-school average of 158, and 2.2 times the average government school (115). Government-aided schools, at 306 students per school, are the largest on average of any management type — a legacy of their historical concentration in urban and semi-urban areas as large, well-established institutions, many predating Independence. These size differentials explain why private and aided schools collectively command an enrolment share (48.5% combined) that substantially exceeds their institutional share (28.7% combined).
The fact that private schools’ average size (258) exceeds the all-school average (158) by 63% is itself sufficient to sustain their disproportionate enrolment share even without rapid numerical expansion. This size premium — more than the raw count of private institutions — is the primary mechanism through which enrolment share continues to shift even in years when institutional counts are broadly stable. A private school sector that adds few new schools can still capture a growing share of enrolment simply by each existing school enrolling more students than the sector average — through larger sections, additional classrooms, or absorbing students leaving smaller government or aided schools nearby.
State-wise Share of Private and Aided Schools: 2025-26
The landscape of school education in India in 2025-26 reveals profound regional variation in the weight of private unaided and government-aided institutions, reflecting historical policy choices, socio-economic structures, religious and linguistic legacies, and differing state-building trajectories in education.

| State/UT | Pvt. Sch. % | Aided Sch. % | Pvt. Enrol. % | Aided Enrol. % | Avg Pvt Size | Avg Aided Size |
|---|---|---|---|---|---|---|
| Andaman & Nicobar | 18.0% | 0.5% | 28.6% | 2.9% | 235 | 866 |
| Andhra Pradesh | 25.8% | 1.3% | 54.9% | 1.2% | 278 | 120 |
| Arunachal Pradesh | 19.0% | 2.2% | 37.5% | 7.1% | 179 | 293 |
| Assam | 12.4% | 2.7% | 28.1% | 2.0% | 268 | 89 |
| Bihar | 12.9% | 0.8% | 13.5% | 0.6% | 222 | 158 |
| Chandigarh | 40.9% | 3.4% | 37.2% | 3.6% | 956 | 1124 |
| Chhattisgarh | 13.4% | 0.7% | 29.8% | 1.3% | 205 | 164 |
| Delhi | 48.2% | 4.2% | 41.4% | 3.2% | 631 | 559 |
| Goa | 9.7% | 37.9% | 12.2% | 73.7% | 230 | 354 |
| Gujarat | 24.8% | 10.2% | 39.0% | 15.9% | 313 | 309 |
| Haryana | 36.5% | 0.0% | 60.6% | 0.0% | 382 | — |
| Himachal Pradesh | 15.2% | 0.0% | 42.0% | 0.0% | 194 | — |
| Jammu & Kashmir | 22.3% | 0.0% | 46.3% | 0.0% | 190 | 127 |
| Jharkhand | 4.1% | 2.6% | 19.4% | 3.7% | 772 | 231 |
| Karnataka | 25.9% | 9.0% | 49.3% | 11.5% | 290 | 196 |
| Kerala | 19.3% | 45.4% | 27.0% | 43.9% | 489 | 337 |
| Ladakh | 12.7% | 4.3% | 51.3% | 1.5% | 209 | 18 |
| Lakshadweep | 0.0% | 0.0% | 0.0% | 0.0% | — | — |
| Madhya Pradesh | 22.7% | 0.4% | 41.8% | 0.6% | 212 | 168 |
| Maharashtra | 16.5% | 23.6% | 30.2% | 46.4% | 358 | 384 |
| Manipur | 22.7% | 12.6% | 64.8% | 3.7% | 359 | 37 |
| Meghalaya | 16.6% | 33.1% | 22.3% | 42.6% | 107 | 102 |
| Mizoram | 27.9% | 5.8% | 49.5% | 8.0% | 108 | 84 |
| Nagaland | 29.9% | 0.0% | 67.9% | 0.0% | 283 | — |
| Odisha | 10.3% | 9.3% | 20.7% | 12.8% | 239 | 163 |
| Puducherry | 41.3% | 4.3% | 59.6% | 9.1% | 395 | 580 |
| Punjab | 27.7% | 1.6% | 51.4% | 3.4% | 338 | 392 |
| Rajasthan | 31.9% | 0.0% | 49.7% | 0.0% | 219 | — |
| Sikkim | 30.4% | 1.2% | 37.5% | 0.4% | 96 | 24 |
| Tamil Nadu | 20.3% | 14.2% | 45.8% | 16.6% | 443 | 229 |
| Telangana | 31.7% | 0.9% | 61.6% | 1.0% | 327 | 172 |
| Tripura | 11.5% | 0.8% | 21.9% | 4.5% | 246 | 681 |
| Uttar Pradesh | 40.7% | 3.1% | 52.3% | 10.3% | 200 | 513 |
| Uttarakhand | 24.7% | 2.7% | 57.5% | 6.6% | 225 | 233 |
| West Bengal | 4.3% | 0.1% | 6.4% | 0.2% | 261 | 427 |
| India (Overall) | 23.3% | 5.4% | 38.0% | 10.5% | 258 | 306 |
Source: UDISE+ 2025-26, Table 8.1 (schools by management, state-wise) and Tables 5.2–5.5 (enrolment by management and level, state-wise). Enrolment% is Class I–XII. Avg size = I–XII enrolment ÷ school count for that management type in that state; “—” indicates zero or negligible schools of that type. Bihar and Punjab avg-aided-size figures reflect very small aided school counts (717 and 435 schools respectively) and should be read with that caveat.
Regional Patterns: Distinct Models of School Provision
Model 1: High-Privatisation States — a Larger and More Varied Group Than a North-East-Only Story
The states with the highest private enrolment share span every region of India, not only the north-east. Nagaland (67.9%), Telangana (61.6%), Haryana (60.6%), Puducherry (59.6%), Uttarakhand (57.5%), Andhra Pradesh (54.9%) and Uttar Pradesh (52.3%) all exceed 50% private enrolment — a group that includes India’s most populous state (UP) alongside small hill and union territory administrations. Punjab (51.4%), Rajasthan (49.7%), Mizoram (49.5%) and Karnataka (49.3%) sit just below that threshold. This is a materially larger and more geographically dispersed set of high-privatisation states than a north-east-specific narrative would suggest: the private-majority phenomenon is now a mainstream pattern across large and small states alike, not a regional anomaly confined to areas with historically weak public provision.
Model 2: Southern and Western States with Strong Aided Sectors
Goa (73.7% aided enrolment) and Maharashtra (46.4%) have the strongest aided sectors in the country by enrolment share, sustained by minority-managed and missionary institutions and, in Maharashtra’s case, a large historical network of linguistically organised aided schools. Kerala’s aided sector (43.9% of enrolment) is large and consequential — the single biggest non-government share of any major southern state — but does not, on the corrected 2025-26 figures, constitute an outright majority of the state’s enrolment as sometimes claimed; it is best described as the largest single sector in a genuinely three-way split with government (roughly 29%) and private (27.0%) schools. Meghalaya (42.6%), Tamil Nadu (16.6%), Gujarat (15.9%) and Karnataka (11.5%) also retain meaningful aided sectors. In these states, the aided school continues to be a significant vehicle of educational access — often combining public accountability with the institutional continuity of long-established management.
Model 3: High-Privatisation States Without a Counterbalancing Aided Sector
Haryana (60.6% private enrolment, 0.0% aided), Telangana (61.6% private, 1.0% aided), Rajasthan (49.7% private, 0.0% aided) and Uttarakhand (57.5% private, 6.6% aided) illustrate a distinct pattern: high private enrolment share with essentially no aided sector to provide an intermediate, publicly-accountable non-government option. In these states, families choosing not to use government schools have, in practice, only the private market as an alternative — without the fee-regulation and inclusion norms that typically apply to aided institutions in states like Kerala or Maharashtra.
Model 4: Government-Dominant Large States
West Bengal (93.4% government/others, only 6.4% private and 0.2% aided) and Bihar (85.9% government/others, 13.5% private and 0.6% aided) remain overwhelmingly dependent on direct government provision, alongside Jharkhand (19.4% private, 3.7% aided). These are also states that, in this site’s companion analyses, show some of the weakest school-efficiency outcomes nationally (Bihar’s Higher Secondary retention, for example, is the lowest of any large state). The combination of near-total government provision and comparatively weak outcomes in these states does not, by itself, validate privatisation as the solution — but it does underline that the quality of government schooling in these specific states is an urgent and distinct policy concern from the enrolment-share question examined in this article.
Model 5: Delhi and Chandigarh Are High-Privatisation Cities, Not Exceptions
Delhi’s private enrolment share is 41.4% and Chandigarh’s is 37.2% — the national average is 38.0%, meaning Delhi sits slightly above it and Chandigarh sits just below it. This corrects an important misreading of the data: Delhi and Chandigarh are not low-privatisation “urban paradoxes” where strong government schools have held private growth in check. They are, in fact, close to the national average on private enrolment share, consistent with their high household incomes and dense urban school markets. What does distinguish Delhi is its exceptionally large average private-school size (631 students) and aided-school size (559 students) — reflecting genuinely large, well-resourced urban institutions rather than a large number of small ones — and a correspondingly higher share of private schools among total institutions (48.2%) than among total enrolment (41.4%), meaning Delhi’s private schools are, on average, only modestly larger than the city’s schools overall, unlike the much larger size premium seen nationally.
A Genuine Aided-Sector Anomaly: Chandigarh and Tripura, Not Chhattisgarh
Chandigarh records the highest average government-aided school size in the country at 1,124 students per school — more than 7 times the national all-school average — reflecting a very small number of large, historically established aided institutions in the union territory (aided schools are just 3.4% of Chandigarh’s school count but 3.6% of its enrolment, at a scale per school far above the norm). Tripura’s aided schools average 681 students, similarly reflecting a small, concentrated aided sector. Both figures are structural anomalies driven by a handful of very large institutions rather than a systemic pattern, and state-level average-size figures for small aided sectors should generally be read with this caveat in mind — the smaller the number of aided schools in a state, the more a single very large or very small institution can distort the average.
Beyond Enrolment Share: What This Means for Quality and Equity
Enrolment share alone does not tell us whether the shift toward private and away from aided schooling is good or bad for the children involved — that requires bringing in evidence this article’s companion UDISE+ 2025-26 analyses on this site have separately established. Three findings from that body of work are directly relevant here and worth stating plainly rather than leaving the enrolment-share data to speak for quality on its own:
Pupil-teacher ratios do not favour government schools over private ones at the national level. Private schools’ overall PTR (~21.5:1) is marginally better than government schools’ (~22.5:1), while the aided sector — the sector losing the least enrolment share in relative terms but the one this analysis shows to be structurally most under strain — carries by far the worst PTR of any management type (~31.9:1), above the RTE/NEP 2020 norm of 30:1. The aided sector’s genuine challenge is not primarily enrolment flight; it is chronic under-staffing relative to its enrolment.
Private schools have real, measurable infrastructure advantages, but the gaps are narrower than headline figures sometimes suggest. The private-government gap in internet access (roughly 16 percentage points) and computer access (roughly 13 percentage points) is real and policy-relevant, but should be cited at its verified magnitude rather than an inflated one, since both sides of this debate are better served by accurate figures than by the largest available number.
Government schools retain a decisive and often under-appreciated equity role that a pure enrolment-share analysis does not capture: they provide near-universal geographic access, including through India’s more than one lakh single-teacher schools that serve the most remote and sparsely populated areas, where no private or aided alternative exists or would be commercially viable. The enrolment-share shift documented in this article is concentrated in areas where private schools are a genuine commercial option — largely urban, peri-urban, and economically dynamic rural areas — not in the geographically remote areas where government provision remains, in practice, the only option.
What the 2025-26 Data Confirms: Three Structural Realities
Private enrolment above 38% is a stable, multi-year trend, not a single-year spike. Across five UDISE+ editions, private enrolment share has moved from 31.1% to 38.0% — a gain of roughly 7 percentage points, with some year-to-year variation likely attributable in part to reporting changes rather than pure enrolment shift, but with a consistent overall direction. Any policy scenario that assumes this trend will self-correct without deliberate intervention needs to reckon with that consistency.
The aided sector’s enrolment share has been broadly stable, but its school count and average size are both shrinking. At 10.5% of enrolment in 2025-26, the aided sector sits almost exactly where it stood in 2021-22 (10.0%). The real story is structural erosion at the margins — fewer aided schools, smaller average enrolment per school (306 in 2025-26) — rather than a sudden collapse in enrolment share. Without active policy intervention to sustain and reform the sector, gradual attrition will continue even if the aggregate enrolment share holds steady for a few more years.
The size premium, not the school count, is the mechanism to watch. Private schools’ average size (258) exceeds the national average (158) by 63%. This premium is what allows enrolment share to keep shifting even in years when the number of private schools barely changes. It will continue to drive private enrolment share upward unless government schools grow significantly larger on average — which requires either consolidation of small government schools or substantial enrolment growth in the existing public network.
Concluding Observations: India’s Evolving School Landscape in the Light of NEP 2020
The UDISE+ data from 2021-22 to 2025-26 tell a consistent story: India is experiencing a structural shift of enrolment share from public to private institutions, driven substantially by private schools’ larger average size rather than by their proliferation in number. By 2025-26, private unaided institutions — 23.3% of all schools — educate 38.0% of India’s Class I–XII students. Government schools’ enrolment share stands at 49.7%, just under half. The aided sector’s enrolment share, at 10.5%, has been roughly stable over five years even as the sector’s institutional base has continued to erode.
The NEP 2020 vision of a revitalised public education system as the first choice for most Indian families remains, on this evidence, a work in progress rather than an achieved outcome. Parental choice continues to flow toward private providers wherever household resources and local market conditions permit — but this is not uniform: Bihar, West Bengal and Jharkhand remain overwhelmingly government-dependent, while Delhi and Chandigarh, despite being wealthy and urban, sit close to the national average on private enrolment share rather than standing out as low-privatisation exceptions.
States requiring distinct kinds of policy attention fall into several categories. First, high-privatisation states without a counterbalancing aided sector — Haryana, Telangana, Rajasthan, Uttarakhand, Nagaland — where families choosing not to use government schools have, in practice, only the unregulated private market as an alternative. Second, large demographic states with substantial private enrolment already established — Uttar Pradesh (52.3%), Andhra Pradesh (54.9%), Punjab (51.4%) — where even modest further private growth translates into millions of children. Third, historically aided states facing gradual sector erosion — Kerala, Maharashtra, Goa, Tamil Nadu — where continued closure of aided schools would remove a distinctive, publicly-accountable form of non-government provision that these states have relied on for generations. Fourth, government-dominant states with the weakest outcomes — Bihar, West Bengal, Jharkhand — where the enrolment-share question is secondary to the more fundamental challenge of improving the quality of the government system that the overwhelming majority of children in these states depend on.
The size premium — the fact that private and aided schools are, on average, substantially larger than government schools — has become the principal mechanism of enrolment-share change in Indian school education, operating independently of how many new private schools open in a given year. As long as this size differential persists, the shift of enrolment share from public to private institutions will likely continue even if private school counts grow only slowly. Whether NEP 2020’s public-education vision can meaningfully close this gap will depend less on restricting private school growth and more on making government schools competitive on the dimensions — scale, infrastructure, staffing ratios — where the size premium currently gives private and aided institutions their advantage.
References
Department of School Education and Literacy, Ministry of Education (2026). UDISE+ 2025-26 Flash Statistics: Existing Structure Report (Table 8.1, Tables 5.2–5.5). Released 7 July 2026. udiseplus.gov.in
UDISE+ 2021-22 to 2024-25: Respective annual reports. udiseplus.gov.in
Ministry of Education, Government of India (2020). National Education Policy 2020. education.gov.in
Department of School Education and Literacy (2021). Samagra Shiksha: Framework for Implementation. samagra.education.gov.in
National Institute of Educational Planning and Administration. niepa.ac.in
Suggested Readings from Education for All in India
• Progress in Retention Amid Persistent Challenges: UDISE+ 2025-26 — full dropout, transition and retention analysis of which the gender dimension in this article is a deep-dive.
• Impact of NER at School Level on Higher Education in India — the gender pipeline from NER to higher education access, with AISHE linkage.
• India’s School Teachers Reach 1.03 Crore: UDISE+ 2025-26 — detailed female teacher analysis including state-wise patterns.
• Girl Child Education in India: Progress and Persistent Gaps — the historical trajectory of girls’ education in India.
• Are BIMARU States Still BIMARU? UDISE+ 2025-26 — Bihar’s gender dropout reversal and Rajasthan’s girls’ enrolment patterns in state context.
• Muslim Education in India: UDISE+ 2025-26 — the intersection of religious minority and gender disadvantage in India’s education pipeline.
• Distribution of Schools, Enrolment and Teachers: UDISE+ 2025-26 — the structural school distribution analysis that underlies gender access patterns.
• Trained and Professionally Qualified Teachers: UDISE+ 2025-26 — the female teacher quality dimension and its connection to girls’ retention outcomes.
• Private vs. Government Schools: UDISE+ 2025-26 — female teacher share by management type (Govt 59.1% vs Private 48.2%) and its equity implications.
• School Education Development Index (SEDI) 2025-26 — GPI is a key input in SEDI’s Equity domain for all 36 states/UTs.
From Class 1 to College: Where Does India’s Education Pipeline Narrow?
How to cite: Mehta, A.C. (2026). The Size Premium: How Private and Government-Aided Schools Are Reshaping India’s Enrolment Map — A Full State-by-State UDISE+ 2025-26 Analysis. educationforallinindia.com.