Size of Muslim Population in India: 1951 to 2011 (2023)
As of the 2011 Census, the Muslim population in India constituted approximately 14.23 percent of the total population. In several states, this percentage was significantly higher than the national average, with the highest concentration in undivided Jammu & Kashmir, followed by the Union Territory of Lakshadweep, West Bengal, and others. It is widely acknowledged that, in terms of education, Muslims in India have not achieved parity with other minority segments. However, up-to-date data on the current status of the Muslim population is not available, as the 2021 Census has not been conducted yet. Nevertheless, thanks to initiatives like the District Information System for Education (DISE), later UDISE, and now UDISE+ & AISHE, sufficient information exists about the educational status of Muslim minorities in India.
While the information on Muslim enrolment, along with Scheduled Castes (SC) and Scheduled Tribes (ST) enrolment, is available through UDISE+ at all levels of school education, the Census does not cover the population of the Other Backward Class (OBC). The UDISE fills this gap by collecting enrolment data on the OBC, making it a unique and essential source for plan formulation. Despite enrolment and repeaters data availability, one critical piece of information missing is the enrolment ratios, which require data on the Muslim child population in the relevant age group. Currently, Muslim enrolment by age is not collected in UDISEplus.
An article by John Kurrien in Hindustan Times on 2nd March 2021 argued that data on the education of Muslims was not provided in the Department of Education’s “Educational Statistics at a Glance” for 2018. However, the article failed to mention that this data had been published in UDISE Flash Statistics from 2005-06 to 2017-18 and is still being collected as part of the annual data collection in UDISEplus and is available in the Flash Statistics for 2018-19 to 2021-22, published by the Department of School Education & Literacy, Ministry of Education.
In summary, while adequate information is available about the education of Muslim minorities through UDISE+, some crucial data points, such as enrolment ratios, still require information on the Muslim child population by age. Nonetheless, efforts are being made to gather and disseminate essential data to address educational disparities and formulate appropriate plans for developing the Muslim population and other minority groups in India.Top of Form
Muslim & Total Population: India, 1951 to 2011
Let us examine the religious composition of the population from Census 1951 to 1961 to 2001 to 2011, which indicates changes in all population segments. During the two censuses, the population of Hindus, Muslims, and Christians experienced a decline. After independence in 1951, India’s total population was 361 million, which increased to 1,211 million in 2011, showing an absolute increase of 850 million or a 235.46 percent increase in percentage terms over 60 years. In the same period from 1951 to 2011, India’s population grew by 3.25 fold, Hindu population increased by 3.18 fold, and Muslim population increased by 4.91 fold. Specifically, the Hindu population increased from 304 million in 1951 to 966 million in 2011, representing a 217.76 percent increase, while the Muslim population increased by 137 million (391.43 percent) during the same period.
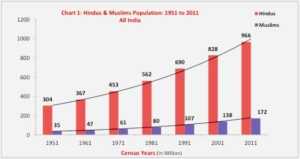
Hindus & Muslim Population: 1951 to 2011, All India
Regarding the percentage share of the total population of India, Hindus constituted 84.1 percent in 1951, the highest figure from 1951 to 2011 (Table 1). On the other hand, the Muslim population’s share of the total population was the lowest at 9.8 percent in 1951. However, this proportion consistently increased to 10.7 percent in 1961, 12.6 percent in 1991, 13.4 percent in 2001, and 14.2 percent in the latest Census 2011. The 14.2 percent share of the Muslim population is the highest recorded from 1951 to 2011, whereas the lowest was 9.8 percent in 1951.
Conversely, the share of the Hindu population in the total population has consistently declined from 1961 to 2011. However, in absolute terms, it remains significantly higher than the Muslim population. In 1951, the Hindu-to-Muslim population ratio was 8.69:1, which decreased to 5.62:1 in the latest Census of 2011. Further information about the current share of different population segments will be revealed once the 2021 Census is conducted.
Total 1: Population of India: 1951 to 2011 (In Million)
| Between Census Years | Hindus | % Hindus to Total population | Muslims | % Muslims to Total Population |
All Population (Total) |
| 1951 | 304 | 84.1 | 35 | 9.8 | 361 |
| 1961 | 367 | 83.5 | 47 | 10.7 | 439 |
| 1971 | 453 | 82.7 | 61 | 11.2 | 548 |
| 1981 | 562 | 82.3 | 80 | 11.8 | 683 |
| 1991 | 690 | 81.5 | 107 | 12.6 | 846 |
| 2001 | 828 | 80.5 | 138 | 13.4 | 1029 |
| 2011 | 966 | 79.8 | 172 | 14.2 | 1211 |
Source: Economic Survey 2021-22.
Percentage Increase in Population
The percentage increase in population between the two censuses from 1951 to 2011 is presented in Table 2. It reveals that the pace of population increase has decreased for Hindus, Muslims, Christians, and the total population of India, although the growth remains high across all religious groups. Between the 2001 and 2011 Censuses, the population of India increased by 17.7 percent, compared to 21.5 percent between 1991 and 2001. The growth rate was as high as 24.7 percent between the Censuses of 1971 and 1981.
In the latest Censuses, between 2001 to 2011, the population of Muslims increased by 24.7 percent, which is higher than the increase in the population of Hindus (16.7 percent) and Christians (15.7 percent) during the same period. However, it is essential to note that the share of Sikhs (1.72 percent), Jains (0.37 percent), and Buddhists (0.70 percent) is relatively low and has declined during the period from 1951 to 2011.
Table 2: Percentage Increase of Population: All India, 1951-61 to 2001-11
| Between Census Years | Hindus | Muslims | Christians | All Population |
| 2011-21* | ||||
| 2001-11 | 16.7 | 24.7 | 15.7 | 17.7 |
| 1991-2001 | 19.9 | 29.4 | 22.6 | 21.5 |
| 1981-91 | 22.7 | 32.9 | 17.8 | 23.9 |
| 1971-81 | 24.0 | 30.7 | 17.0 | 24.7 |
| 1961-71 | 23.7 | 30.9 | 33.0 | 24.8 |
| 1951-61 | 20.7 | 32.7 | 29.0 | 21.6 |
*Census 2021 is yet to be conducted.
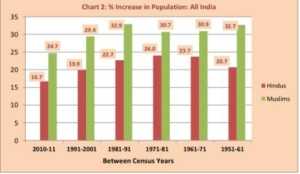
Percentage increase in Hindus & Muslim population between Censuses: 1951 to 2011
Average Annual Growth Rates
Table 2 presented earlier only highlighted the percentage increase between the two Censuses, which did not provide the specific rate at which the population of a particular segment has increased or declined. To address this, the compound Growth Rate formula is used to calculate the rate of change in the population of Hindus, Muslims, and the total population of India between the two Censuses, as well as between the years 1951 to 2011, as shown in Table 4.
Table 3: Percent Share of Population by Religion: 1961 to 2011
|
Religious Group |
Percentage of Population |
||||||
|
Census Year |
|||||||
| 1951 | 1961 | 1971 | 1981 | 1991 | 2001 | 2011 | |
| Hindus | 84.10 | 83.45 | 82.73 | 82.30 | 81.53 | 80.46 | 79.80 |
| Muslims | 9.80 | 10.69 | 11.21 | 11.75 | 12.61 | 13.43 | 14.23 |
| Christians | 2.30 | 2.44 | 2.60 | 2.44 | 2.32 | 2.34 | 2.30 |
| Sikhs | 1.79 | 1.79 | 1.89 | 1.92 | 1.94 | 1.87 | 1.72 |
| Buddhist | 0.74 | 0.74 | 0.70 | 0.70 | 0.77 | 0.77 | 0.70 |
| Jain | 0.46 | 0.46 | 0.48 | 0.47 | 0.40 | 0.41 | 0.37 |
Source: Census of India, different Census years.
The analysis reveals that throughout the Census years, the average annual growth rate of the Muslim population has consistently been higher than the rate of increase in the total population of India. On the other hand, the average annual growth rate of the Hindu population has been lower than the increase in the total population. For example, between 2001 and 2011, the total population of India increased by 17.7 percent. In the same period, the population of Hindus increased by 16.7 percent, and the population of Muslims increased by 24.7 percent.
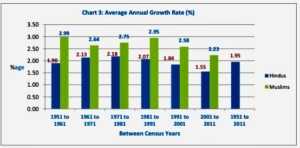
Average Annual Growth Rate in Hindus & Muslims Population: 1951 to 2011
A brief analysis of the average annual growth rate in the population reveals exciting patterns (Table 4). The highest growth rate in the Muslim population was recorded at 2.99 percent from the 1951 Census to 1961. For Hindus, the highest growth rate was observed at 2.18 percent between the Censuses of 1971 and 1981. In contrast, the lowest average growth rates were observed for both Hindus and Muslims at 1.55 percent and 2.23 percent, respectively, from 2001 to 2011. Notably, these rates are the lowest observed throughout the Census (1951 to 2011). The total population also experienced its lowest-ever growth rate at 1.64 percent from 2001 to 2011.
Table 4: Average Annual Growth Rate (%) between two Censuses
1951 to 2011, All India
| Period` | Hindus | Muslims | Total Population |
| 1951 to 1961 | 1.90 | 2.99 | 1.98 |
| 1961 to 1971 | 2.13 | 2.64 | 2.24 |
| 1971 to 1981 | 2.18 | 2.75 | 2.23 |
| 1981 to 1991 | 2.07 | 2.95 | 2.16 |
| 1991 to 2001 | 1.84 | 2.58 | 1.98 |
| 2001 to 2011 | 1.55 | 2.23 | 1.64 |
| 1951 to 2011 | 1.95 | 2.69 | 2.04 |
Source: Computed based on the Census of India, different census years.
Additionally, the average annual growth rate of the population was computed for the entire period from the first Census in 1951 to the latest Census in 2011. During this period, the population of Hindus increased at an average annual growth rate of 1.95 percent per annum, while the Muslim population increased at a higher rate of 2.69 percent per annum. The overall total population of India increased at an average annual growth rate of 2.04 percent per annum during the same period.
Without data on the projected Muslim population, it becomes challenging to compute the enrolment ratio, which indicates the participation of the child population in educational programs. In the absence of such data, the Muslim share of the total population from the latest 2011 Census can be compared with the Muslim share of enrolment at different levels of education. To gain a comprehensive understanding, it is essential to analyze the share of Muslims in both the population and enrolment at all-India and State & UT levels. For this purpose, Table 5 presents the State-specific share of the Muslim population to the total population of each state based on the latest 2011 Census.
State-wise Share of Muslim Population: 2011 Census
The state-wise distribution of the total Muslim population in India in 2011 reveals significant variations. Among the 35 States & UTs, 10 had a negligible Muslim population. In 17 states, Muslims constituted a minority, while in two states, Jammu & Kashmir (68.31 percent, undivided) and Lakshadweep (96.58 percent), they had a majority status. However, the states of Assam, Bihar, Kerala, Uttar Pradesh, and West Bengal accounted for more than 58 percent of India’s total 172.25 million Muslim population in 2011 (Table 5). This concentration of Muslims in these five states is noteworthy, as every 6th out of 10 Muslims in India were located there, signifying their significance in the education of the Muslim community in the country.
Furthermore, 12 states had a Muslim population share above 10 percent in 2011. Some of these states had relatively high shares, such as 12.86 percent in Delhi, 14.53 percent in Jharkhand, 11.54 percent in Maharashtra, and 13.95 percent in Uttarakhand.
While reviewing the educational status of Muslims at different levels of school education at the all-India level, all States & UTs of the country are considered, regardless of the share of the Muslim population in each state. However, the educational status is compared with the Muslim population’s share in the 2011 Census. The share of the Muslim population in the bifurcated States/UTs, if any, has been considered as that of the undivided State/UT.
Table 5: State-wise Share of Muslims to Total Population of India: 2011 Census
| Sl.
No. |
State/UT |
Population 2011 Census |
Status of Muslim Population in the State/UT | ||
| Total | Muslim |
%Share of Muslim to Total State/UT Population |
|||
| 1 | Andaman & Nicobar Islands | 3,80,581 | 32,413 | 8.517 | Minority |
| 2 | Andhra Pradesh | 8,45,80,777 | 80,82,412 | 9.556 | Minority |
| 3 | Arunachal Pradesh | 13,83,727 | 27,045 | 1.955 | Negligible |
| 4 | Assam | 3,12,05,576 | 1,06,79,345 | 34.223 | Significant |
| 5 | Bihar | 10,40,99,452 | 1,75,57,809 | 16.866 | Significant |
| 6 | Chandigarh | 10,55,450 | 51,447 | 4.874 | Negligible |
| 7 | Chhattisgarh | 2,55,45,198 | 5,14,998 | 2.016 | Negligible |
| 8 | Dadra and Nagar Haveli | 3,43,709 | 12,922 | 3.760 | Negligible |
| 9 | Daman and Diu | 2,43,247 | 19,277 | 7.925 | Minority |
| 10 | Delhi | 1,67,87,941 | 21,58,684 | 12.859 | Minority |
| 11 | Goa | 14,58,545 | 1,21,564 | 8.335 | Minority |
| 12 | Gujarat | 6,04,39,692 | 58,46,761 | 9.674 | Minority |
| 13 | Haryana | 2,53,51,462 | 17,81,342 | 7.027 | Minority |
| 14 | Himachal Pradesh | 68,64,602 | 1,49,881 | 2.183 | Negligible |
| 15 | Jammu and Kashmir | 1,25,41,302 | 85,67,485 | 68.314 | Majority |
| 16 | Jharkhand | 3,29,88,134 | 47,93,994 | 14.532 | Minority |
| 17 | Karnataka | 6,10,95,297 | 78,93,065 | 12.919 | Minority |
| 18 | Kerala | 3,34,06,061 | 88,73,472 | 26.562 | Significant |
| 19 | Lakshadweep | 64,473 | 62,268 | 96.580 | Majority |
| 20 | Madhya Pradesh | 7,26,26,809 | 47,74,695 | 6.574 | Minority |
| 21 | Maharashtra | 11,23,74,333 | 1,29,71,152 | 11.543 | Minority |
| 22 | Manipur | 28,55,794 | 2,39,836 | 8.398 | Minority |
| 23 | Meghalaya | 29,66,889 | 1,30,399 | 4.395 | Negligible |
| 24 | Mizoram | 10,97,206 | 14,832 | 1.352 | Negligible |
| 25 | Nagaland | 19,78,502 | 48,963 | 2.475 | Negligible |
| 26 | Orissa | 4,19,74,218 | 9,11,670 | 2.172 | Negligible |
| 27 | Puducherry | 12,47,953 | 75,556 | 6.054 | Minority |
| 28 | Punjab | 2,77,43,338 | 5,35,489 | 1.930 | Negligible |
| 29 | Rajasthan | 6,85,48,437 | 62,15,377 | 9.067 | Minority |
| 30 | Sikkim | 6,10,577 | 9,867 | 1.616 | Negligible |
| 31 | Tamil Nadu | 7,21,47,030 | 42,29,479 | 5.862 | Minority |
| 32 | Tripura | 36,73,917 | 3,16,042 | 8.602 | Minority |
| 33 | Uttar Pradesh | 19,98,12,341 | 3,84,83,967 | 19.260 | Significant |
| 34 | Uttarakhand | 1,00,86,292 | 14,06,825 | 13.948 | Minority |
| 35 | West Bengal | 9,12,76,115 | 2,46,54,825 | 27.011 | Significant |
| All India | 1,21,08,54,977 | 17,22,45,158 | 14.225 | Minority | |
Source: Census of India, 2011.


