Computation of Out-of-School Children Based on Administrative Data (UDISE+ 2021-22)[PDF]
Computation of Out-of-School Children Based on Administrative Data
(UDISE+ 2021-22)
By
Arun C Mehta, Former Professor & Head of EMIS Department, NIEPA, New Delhi
Introduction
Despite spectacular performance in every sphere of school education, India, one of the world’s most populous countries, still faces significant challenges in ensuring access to education for all its children amounting to around 286 million population of age 6 to 18 years. Despite several efforts by the Government of India, many children in India remain out of school. The present article explores the issue of out-of-school children in India, looking into the key factors contributing to this problem and analyzing data and statistics at both the national and state levels.
An effort has also been made to estimate the number of out-of-school children exclusively based on the latest UDISEPlus 2021-22 data.
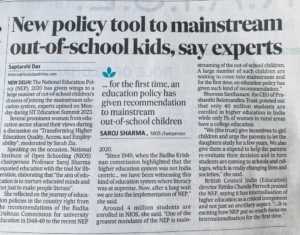
New Policy Tool to Mainstream Out-of-School Children, The Hindustan Times, 29th August 2023
Out-of-School Children
Out-of-school children are those of school-going age (6 to 17+ years) but are not currently enrolled in any educational institution. This group includes those who have never been to school and those who have dropped out prematurely or even failed to transition between the two levels of school education.
On the other hand, never enrolled children, also known as “out-of-school” children, represent those who have never been registered or enrolled in any formal educational institution; these children have never experienced formal education and have not been part of the school system.
Dropout students are those who once enrolled in formal schools but, because of one or another reason, could not complete a grade and dropped out from the system; these children have the option to return to school, but the moot question is what is the period after which if they do not return to schools, could them be considered to drop out?
All three, out-of-school, dropouts, and never enrolled children, are a significant challenge in achieving the goal of universal education, as they indicate unequal access to education and highlight the need for targeted interventions to ensure that all children have an opportunity to receive quality education. More than bringing them under the education umbrella, it is crucial to know their number. However, there is no systematic process in India for collecting information about out-of-school children, given that occasional surveys are the only source of information on out-of-school children, a brief of which is presented below.
Statistics on Out-of-School Children
The statistic that about 25 million children in India are still out of school is from the National Education Policy (NEP) 2020. The 25 million figures are based on several surveys and censuses that have been conducted in India. However, as mentioned above, there is no regular survey on out-of-school children in India but ASER, NFHS, and Census of India are the primary sources of information on out-of-school children, details of which are briefly presented below:
Annual Status of Education Report (ASER)
The latest data from the ASER 2021-22 shows that the number of out-of-school children in India has decreased from 25 million in 2020 to 12.97 million in 2021-22 for the age group 6 to 17 years. Most out-of-school children are located in rural areas, and girls are likelier to be out of school than boys. Further, it is revealed that children from the Scheduled Castes and Scheduled Tribes communities are more likely to remain out of school, which may be because of poverty, gender discrimination, child labor, inaccessibility of schools, and disability.
National Family Health Survey (NFHS)
Another large-scale survey, namely the National Family Health Survey (NFHS-5), which was conducted in 2019-21, found that about 11.3 million children in India were out of school, which also shows a significant decrease from the NFHS-4, which found that about 26 million children in India were out of school in 2015-16.
Census of India
The 2011 Census is the have the most comprehensive data on out-of-school children in India, but Census 2021 is yet to be operationalized. The data shows that 27.2 million children in the age group of 6-13 years in India were not attending school in 2011; most of these children were located in rural areas (72 percent), were from poor households (60 percent), and were from marginalized communities and fifty-one percent were girls. The 2011 Census reveals that the main reasons for children being out of school are poverty, child labor, inaccessibility of schools (15 percent), gender discrimination (10 percent), and disability (5 percent).
State-Level Data and Statistics
The issue of out-of-school children varies significantly across different states in India. Below are statistics from select states as of 2021-22 based on ASER 2021-22; the numbers might have changed since then, but no recent statistics are available.
- Uttar Pradesh: Uttar Pradesh has the highest number of out-of-school children, estimated to be around 2.6 million out of its estimated population of around 200 million.
- Bihar: Bihar follows Uttar Pradesh closely, with approximately 2.02 million children out of school.
- Rajasthan: Rajasthan reports many out-of-school children, with estimates of around 1.2 million.
- West Bengal: West Bengal has made considerable progress but still has around 907 thousand children out of school.
- Maharashtra: As one of India’s more developed states, Maharashtra has reduced the number of out-of-school children but still faces challenges with around 892 thousand such children.
- Assam (1,186,382 children), Chhattisgarh (1,076,415 children), Jharkhand (1,259,809 children), Madhya Pradesh (1,450,905 students), Odisha (1,381,250 children), etc. too had a significant number of out-of-school children in 2021-22.
- On the other hand, Kerala (228,199 children) and Telangana (391,385 children) have comparatively fewer out-of-school children but might be high in percentage terms to total 6 to 17 years of children in the state.
The statistics presented above have different numbers of out-of-school children, and they too available in different years. Alternatively, the out-of-school children can also be estimated based on administrative surveys, such as the UDISEPlus, but the same is also available for 2021-22. Off late, it has been observed that there is again a rise in the time lag in educational statistics. As of today, i.e., 1st of August 2023, UDISEPlus data for 2022-23 should have been available, but there is no option but to use the available statistics.
Estimation of Out-of-School Children based on UDISEPlus 2021-22
To estimate the out-of-school children, the projected child population in different age groups, such as 6 to 10, 11 to 13, 14 to 15, and 16 to 17 years in a year, is required, which is obtained from UDISEPlus 2021-22 Booklet (Table 1). The corresponding age-grade matrix or Net Enrolment Ratio in the corresponding level/grades in the same year for which the child population is available is required to estimate out-of-school children. In the present note, we have used the following enrolment ratios:
- NET
- Adjusted NET
- Age-specific Enrolment Ratio
The child population and the enrolment ratios have been used for 2021-22. Let us first analyze the child population.
The Child Population
The projected child population in Table 1 suggests that India will have 285.5 million children aged 6 to 17 in 2020-21 compared to 286.5 million in the next year, 2021-22. The primary school-going population in 2021-22 is more than 41 percent of the total 6 to 17 years population, which is followed by 25 percent in the case of 11 to 13 years, 17.33 percent in the age group of 16 to 17 years, and 16.90 percent of 14 to 15 years. Given the low enrolment ratios at the secondary and higher secondary levels of education, the size of 14 to 15 and 16 to 17-year population of 9,80,72,000 in 2021-22 must be treated as significant. Further, it is observed that the elementary-level age group population in 2021-22 has a total of 18,83,92000 children together which has a share of 65.76 percent of the 6 to 17-year population. Every 6 out of 10 children aged 6 to 17 falls into the elementary age category of 6 to 13 years. However, the projected population is based on the 2011 Census, and once the more recent population is available, the school-age going population may also dramatically change.
Let us now compute out-of-school children’s details, which are presented in Tables 2 to 9.
Table1: Projected Population in Different Age-groups
| Age-group | 6 to 10 | 11 to 13 | 14 to 15 | 16 to 17 | Total 6 to 17 Years |
| Year | |||||
| 2020-21 | 118144200 | 71448400 | 48900200 | 50056400 | 285549200 |
| 2021-22 | 117842000 | 70550000 | 48425000 | 49647000 | 286464000 |
| %age to Total 6 to 17 Years | |||||
| 2020-21 | 40.94 | 24.76 | 16.95 | 17.35 | 100.00 |
| 2021-22 | 41.14 | 24.63 | 16.90 | 17.33 | 100.00 |
Source: UDISPlus, 2020-21 & 2021-22.
Out-of-School Children Based on NER
Table 2 presents the estimation of Out-of-School children based on Net Enrolment Ratio, which is computed based on the child population in an age group and NER at an educational level. For example, to compute Out-of-School children at the primary level, the corresponding population aged 6 to 10 is considered, which is then applied to NER at this level of education, i.e., 88.6 percent. The balance of children, i.e., 100-88.6 = 11.4 percent of the total 11,78,42,000 children aged 6 to 10 are considered out-of-school. Following the same procedure, out-of-school children in upper primary, secondary, and higher secondary levels of education in 2021-22 have been worked out. Table 2 further reveals that out-of-school children in 2021-22 increased over the previous year, which is valid for all levels of school education. The total number of out-of-school children increased to 9,15,78,989 in 2021-22 from 8,30,44,086 in the previous year 2020-21, thus showing an increase of hoping 10.28 in the percent form or 85,34,903 in absolute terms; this comes to 31.97 percent of the total 28,64,64,000 population aged 6 to 17 years.
Table 2: Out-of-School Children: 2021-22 based on NER
| Year | Educational Level | |||
| Primary | Upper Primary | Secondary | Hr. Sec | |
| Net Enrolment Ratio (%) | ||||
| 2020-21 | 92.7 | 74.1 | 52.5 | 34.7 |
| 2021-22 | 88.6 | 71.3 | 47.9 | 34.2 |
| Out-of-School Children | ||||
| 2020-21 | 8624527 | 18505136 | 23227595 | 32686829 |
| 2021-22 | 13433988 | 20247850 | 25229425 | 32667726 |
| %age to Ttoal | 14.67 | 22.11 | 27.55 | 35.67 |
Source: Calculated based on UDISPlus, different years.
The distribution of the total out-of-school children from primary to higher secondary level (9,15,78,989 students) in 2021-22 further reveals that 35.67 percent alone are at higher secondary level of education, followed by 27.55 percent at secondary, 22.11 percent at upper primary and 14.67 percent at primary level of education; indicating that as we move from primary to upper primary and higher levels incidence of dropout also increase with each level influencing efforts currently being made to achieve the uncherished goal of school education in India.
Table 3: Level-specific Enrolment: 2020-21 & 2021-22
| Level | 2020-21 | 2021-22 | Change | %age Change |
| Primary | 122021291 | 121842250 | -179041 | -0.15 |
| Upper Primary | 65854199 | 66790692 | 936493 | 1.42 |
| Elementary | 187875490 | 188632942 | 757452 | 0.40 |
| Secondary | 39006375 | 38528631 | -477744 | -1.22 |
| Higher Secondary | 26922596 | 28579050 | 1656454 | 6.15 |
| Total, Grades 1 to 12 | 253804461 | 255740623 | 1936162 | 0.76 |
Source: UDISE+, different years.
Table 4: Number of Schools (All Schools): All-India
| Year
|
Total Number
of Schools |
Increase/
Decrease
|
%age
Change
|
Total Government/
DoE Schools
|
Increase/ Decrease
|
Total Private Schools
|
Increase/ Decrease
|
| 2017-18 | 15,58,903 | 1094543 | 322201 | ||||
| 2018-19 | 15,51,000 | -7,903 | -0.5 | 1083747 | -10796 | 326228 | 4027 |
| 2019-20 | 15,07,708 | -43,292 | -2.8 | 1032570 | -51177 | 337499 | 11271 |
| 2020-21 | 15,09,136 | 1,428 | 0.09 | 1032149 | -521 | 343314* | 5815 |
| 2021-22 | 14,89,115 | -20,021 | -1.33 | 1022386 | -9663 | 335844 | -7470 |
| 2017-18 to 2021-22 | -69,788 | -4.48% | -72,157 | -6.59 % | 13,643 | 4.23% |
Source: UDISE & UDISE+, different years. *Number of published schools were 3,40,753 schools in 2020-2.
Another critical issue is an erratic enrolment pattern which sees sudden up or downward trends that are unexplainable (Table 3). No explanation is provided in the Official Booklet based on UDISEPlus data nor for the dramatic decline in the number of schools covered under UDISEPlus in recent years (Table 4). Is the decrease in the number of schools attributed to the amalgamation or closure of educational institutions an unresolved issue with no publicly available information?
An Important Question
In the estimation of out-of-school children based on the Net Enrolment Ratio presented above, it is assumed that those who are not enrolled, for example, at the primary level, of those aged 6 to 10 years, are termed as out-of-school. Are all of them termed as out-of-school children? Not necessarily all of them may be termed as out-of-school as a few of this age group children are enrolled in one level above the primary level, i.e., upper primary level captured in the Adjusted-NER presented in Table 5.
The comparison of NER and Adjusted-NER presented in the Table 5 reveals that Adjusted-NER, irrespective of educational level, is higher than the Net Enrolment Ratio, valid for both 2020-21 and 2021-22, thus clearly indicating that a good number of children, for example of age group 6 to 10 years are also enrolled in higher grades, i.e., Upper Primary grades. As against a NER of 88.6 percent at the primary level, the corresponding Adhusted-NER is 99.1 percent indicating that about 10.5 percent of children 6 to 11 years are enrolled in upper primary classes whom we can not treat as out-of-school children as they are very much a part of the system. That is why the estimation of out-of-school children and planning to bring them under the education umbrella must be based on Adjusted NER and not only based on NER.
Table 5: NER & Adjusted-NER: 2020-21 % 2021-12
|
Year |
Educational Level | ||
| Primary | Upper Primary |
Secondary |
|
|
Adjusted-NER (%) |
|||
| 2020-21 | 98.6 | 84.4 | 61.8 |
| 2021-22 | 99.1 | 87.3 | 64.7 |
| Net Enrolment Ratio (%) | |||
| 2020-21 | 92.7 | 74.1 | 52.5 |
| 2021-22 | 88.6 | 71.3 | 47.9 |
Source: UDISEPlus, 2020-21 & 2021-22.
Therefore, in the next exercise, we have estimated Out-of-School children at different levels based on Adjusted-NER and presented the same in Table 6, which shows a dramatic decline in out-of-school children in 2021-22 compared to the same based on the NER. Tables 6 & 7 reveal a total of 2,71,14,453 out-of-school children in 2021-22 compared to 3,14,79,845 students at primary, upper primary, and secondary levels of education in 2020-21, which is computed based on adjusted NER. Because of the data limitations, the Adjusted-NER at the higher secondary level is unavailable. It may be recalled that India has a total projected population of 23,68,17,000 children aged 6 to 15 years in 2021-22, of which 11.45 percent are out-of-school, not enrolled in Grades I to X, indicating that eleven in every hundred students of age 6 to 15 years were out-of-school is a considerable number and have severe implications for India’s desire to achieve the goal of universal school education by 2030 as envisaged in NEP 2020.
Table 7 further reveals that based on the adjusted NER, the estimated number of out-of-school children at the primary level in 2021-22 was 10,60,578 children compared to the same at upper primary (89,59,850 children) and elementary (1,00,20,428 children) level, which is respectively 0.90, 12.7 and 5.32 percent of the corresponding child population of 11,78,42,000 (6 to 10 years), 7,05,50,000 (11 to 13 years) and 18,83,92,000 (6 to 13 years). It may be recalled that based on NER, the estimated out-of-school children were 1,34,33,988 children (11.4 percent) at primary, 2,02,47,850 children (28.7 percent) at upper primary, and 3,36,81,838 children (17.88 percent) at the elementary level of education; thus suggesting that a good number of children enter into the education system at a much younger age than prescribed age of 6 years. Children are expected to enter the system at the appropriate age as we reach universalization. Eventually, GER will become equal to NER and adjusted NER, and all three will become the same.
Table 6: Out-of-School Children: 2021-22 based on Adjusted-NER
|
Year |
Educational Level | ||
| Primary | Upper Primary | Secondary | |
|
Adjusted-NER (%) |
|||
| 2020-21 | 98.6 | 84.4 | 61.8 |
| 2021-22 | 99.1 | 87.3 | 64.7 |
| Out-of-School Children | |||
| 2020-21 | 1654019 | 11145950 | 18679876 |
| 2021-22 | 1060578 | 8959850 | 17094025 |
Source: Calculated based on UDISPlus, different years.
Table 7: Out-of-School Children: 2021-22
|
Year
|
Estimated Out-of-School Children, 2021-22 | ||||
| Primary | Upper Primary | Elementary | Secondary | Total Primary to Secondary | |
|
Based on NER |
|||||
| 2020-21 | 8624527 | 18505136 | 27129663 | 23227595 | 50357258 |
| 2021-22 | 13433988 | 20247850 | 33681838 | 25229425 | 58911263 |
|
Based on Adjusted-NER |
|||||
| Primary | Upper Primary | Elementary | Secondary | Total Primary to Secondary | |
| 2020-21 | 1654019 | 11145950 | 12799969 | 18679876 | 31479845 |
| 2021-22 | 1060578 | 8959850 | 10020428 | 17094025 | 27114453 |
| %age OOC | 0.90 | 12.7 | 5.32 | – | 11.45 |
Source: Calculated based on UDISPlus, different years.
Table 8: State-wise Number of Out-of-School Children based on Adjusted Net Enrolment Rate, 2021-22
| State/UT | Primary (1 to 5) | Upper Primary (6 to 8) | Elementary (1 to 8) | ||||||
| Boys | Girls | Total | Boys | Girls | Total | Boys | Girls | Total | |
| India | 1492824 | 0 | 1060578 | 4750070 | 4251500 | 8959850 | 6242894 | 4251500 | 10020428 |
| A & N | 6777 | 5459 | 12221 | 4571 | 3945 | 8505 | 11348 | 9405 | 20725 |
| Andhra Pradesh | 63030 | 31572 | 95290 | 83842 | 98010 | 182204 | 146872 | 129582 | 277494 |
| Arunachal Pradesh | 0 | 0 | 0 | 14670 | 12304 | 27007 | 14670 | 12304 | 27007 |
| Assam | 0 | 0 | 0 | 177625 | 80271 | 258903 | 177625 | 80271 | 258903 |
| Bihar | 36260 | 0 | 36260 | 531464 | 398592 | 928070 | 567724 | 398592 | 928070 |
| Chandigarh | 14832 | 7076 | 21920 | 8396 | 3032 | 11426 | 23229 | 10108 | 33346 |
| Chhattisgarh | 117260 | 104489 | 223040 | 127840 | 111456 | 237372 | 245100 | 215945 | 460412 |
| D & N& D & D | 6838 | 4135 | 10962 | 4249 | 2773 | 7008 | 11086 | 6907 | 17970 |
| Delhi | 0 | 0 | 0 | 0 | 0 | 0 | 0 | 0 | 0 |
| Goa | 9713 | 6620 | 16345 | 8914 | 6976 | 15873 | 18628 | 13596 | 32218 |
| Gujarat | 380424 | 179724 | 561242 | 288320 | 265530 | 552896 | 668744 | 445254 | 1114138 |
| Haryana | 70824 | 36960 | 106683 | 57889 | 47448 | 105996 | 128713 | 84408 | 212679 |
| Himachal Pradesh | 0 | 0 | 0 | 9381 | 3476 | 12024 | 9381 | 3476 | 12024 |
| Jammu and Kashmir | 0 | 0 | 0 | 199500 | 153900 | 354162 | 199500 | 153900 | 354162 |
| Jharkhand | 38140 | 0 | 40216 | 207260 | 180796 | 387614 | 245400 | 180796 | 427830 |
| Karnataka | 0 | 0 | 0 | 0 | 0 | 0 | 0 | 0 | 0 |
| Kerala | 0 | 0 | 0 | 771 | 4440 | 6048 | 771 | 4440 | 6048 |
| Ladakh | 4916 | 3619 | 8519 | 4750 | 3168 | 7913 | 9665 | 6787 | 16432 |
| Lakshadweep | 825 | 725 | 1552 | 735 | 1104 | 1838 | 1560 | 1829 | 3390 |
| Madhya Pradesh | 870740 | 769880 | 1643374 | 521560 | 528747 | 1051797 | 1392300 | 1298627 | 2695171 |
| Maharashtra | 0 | 0 | 0 | 270952 | 250614 | 519048 | 270952 | 250614 | 519048 |
| Manipur | 0 | 0 | 0 | 20648 | 16196 | 36743 | 20648 | 16196 | 36743 |
| Meghalaya | 0 | 0 | 0 | 26067 | 9955 | 36115 | 26067 | 9955 | 36115 |
| Mizoram | 0 | 0 | 0 | 5285 | 3715 | 8999 | 5285 | 3715 | 8999 |
| Nagaland | 10584 | 5481 | 16034 | 33298 | 26354 | 59603 | 43882 | 31835 | 75637 |
| Odisha | 44400 | 45318 | 89825 | 176066 | 163392 | 340500 | 220466 | 208710 | 430325 |
| Puducherry | 15306 | 13631 | 28920 | 10023 | 8240 | 18221 | 25329 | 21871 | 47141 |
| Punjab | 40320 | 25142 | 64697 | 137592 | 80868 | 218960 | 177912 | 106010 | 283657 |
| Rajasthan | 252180 | 127890 | 377136 | 363320 | 424512 | 785400 | 615500 | 552402 | 1162536 |
| Sikkim | 996 | 1222 | 2204 | 7289 | 6245 | 13537 | 8285 | 7467 | 15741 |
| Tamil Nadu | 38164 | 0 | 10420 | 24390 | 24688 | 50704 | 62554 | 24688 | 61124 |
| Telangana | 0 | 0 | 0 | 38236 | 18906 | 57528 | 38236 | 18906 | 57528 |
| Tripura | 0 | 0 | 0 | 18327 | 13357 | 31679 | 18327 | 13357 | 31679 |
| Uttar Pradesh | 595396 | 0 | 593450 | 1123512 | 1053916 | 2178540 | 1718908 | 1053916 | 2771990 |
| Uttarakhand | 0 | 0 | 0 | 25420 | 17472 | 42559 | 25420 | 17472 | 42559 |
| West Bengal | 0 | 0 | 0 | 333902 | 295792 | 631540 | 333902 | 295792 | 631540 |
Source: Calculated based on UDISPlus, different years.
Based on the adjusted NER, the out-of-school children at the primary level in 2021-22 suggest that with a little push, India can achieve the goal of a universal primary level of education. However, the same is not valid for upper primary and higher levels as the number of out-of-school children at these levels is still above 10 percent, thus suggesting concerted efforts to bring all out-of-school children under the education umbrella.
The adjusted net enrolment rate (ANER) is a critical indicator that reflects the proportion of children enrolled in a specific level of education compared to the eligible age group. Based on ANER, the estimated out-of-school children reveal significant disparities in educational access across different States & Union Territories. While some states have made commendable progress in reducing the number of out-of-school children, others continue to struggle with high dropout rates and low enrolment.
For state-specific out-of-school children based on adjusted NER is presented in Table 8, an analysis of which is presented below.
Primary Level (Grades 1 to 5)
India reported 1,492,824 out-of-school boys at the primary level, indicating an alarming number of young boys not attending school. However, the data shows zero out-of-school girls, which may raise concerns about the accuracy of the reported figures or potential gender-based disparities. Among the states, Madhya Pradesh stands out with a distressing count of 16,43,374 out-of-school children, raising questions about the state’s efforts to ensure primary education for all. In contrast, states like Chandigarh and Goa show relatively low out-of-school children, reflecting positive strides in primary education. At least fifteen states reported zero out-of-school children in 2021-22, which is encouraging.
Upper Primary Level (Grades 6 to 8)
The overall scenario improves at the upper primary level, with a total of 89,59,850 children enrolled, compared to 10,60,578 at the primary level. However, specific states like Bihar (9,28,070 Out-of-School) continue to face challenges in transitioning children from primary to upper primary education, as evidenced by the high number of out-of-school children in this age group. Notably, some states like Delhi and Karnataka report zero out-of-school children at the upper primary level, indicating potential success in ensuring access to education for older age groups.
The state-wise analysis of out-of-school children presented above based on the adjusted net enrolment rate highlights the persisting challenges in achieving universal education in India. While progress has been made, substantial work remains to ensure every child’s right to education. Top of Form
Is there any other way to estimate Out-of-School children?
The answer to the above question is Yes. Depending upon enrolment availability by age, the same can also be estimated based on the age-specific enrolment ratio, thanks to the efforts made through the UDISE because of which age and grade matrix is available by using which age-specific enrolment ratios can be worked out. The UDISEPlus Booklet presents the same for 2021-22 in the age groups of 6 to, 11 to 13, 14 to 15, and 16 to 17 years which has been used to estimate out-of-school children and presented in Table 8. Age-specific Enrolment Ratio (ASER) is calculated for an age group/single age irrespective of grades/level of education.
An ASER of 99.1 percent indicates that 99.1 percent of children aged 6 to 11 are enrolled but not necessarily enrolled in the corresponding Grades I to V (Table 9). Otherwise, only 0.90 percent of children are yet to be enrolled, which is quite similar to one estimated based on adjusted NER. On the other hand, 7.8 percent, 27.2 percent, and 57.6 percent of children of age groups 11 to 13, 14 to 15, and 16 to 17 were out-of-school in 2021-22. The percentage specifically of age groups 14 to 15 and 16 to 17 corresponding to the secondary and higher secondary levels is alarming. Further, it is also observed that out-of-school children estimated based on ASER reveal a decline in 2021-22 over the previous year. The total elementary age group 6 to 13 years had a
Table 9: Out-of-School Children: Based on Age-specific Enrolment Ratio, 2021-22
|
|
Age Group (in Years) | |||
| Year | 6 to 10 | 11 to 13 | 14 to 15 | 16 to 17 |
|
Age-specific Enrolment Ratio (%) |
||||
| 2020-21 | 98.6 | 91.6 | 73.4 | 46.3 |
| 2021-22 | 99.1 | 92.2 | 72.8 | 42.4 |
|
Out-of-School Children |
||||
| 2020-21 | 1654019 | 6001666 | 13007453 | 26880287 |
| 2021-22 | 1060578 | 5502900 | 13171600 | 28596672 |
| %age OOC 2021-22 | 0.90 | 7.8 | 27.2 | 57.6 |
Source: Calculated based on UDISPlus, different years.
total of 65,63,478 children, of which 16 percent (1060578 children) are of the 6 to 11 age group. The remaining 84 percent (1060578 children) are 11 to 13 years old, all suggesting that concerted efforts are required to bring all out-of-school children under the education umbrella. Altogether, there are 4,83,31,750 children out-of-school in 2021-22 of age group 6 to 17 years. It must be quickly tackled to ensure that India attains the status of universal school education by 2030. This is not likely to happen until the efficiency of school education is improved significantly. Another essential task is to find the reasons for children being out of school and adoption of strategies reason specific and the incorporation of the same in the Annual plan & Budget being formulated annually under the flagship ongoing Samagra Shiksha.
Out-of-School Children in India: A Glimpse into the State of Education
The estimation of out-of-school children in the present article is based on either the NER or adjusted NER and age-specific enrolment ratio, which can be used based on objectives. However, suppose the overall objective is to know how many children of an age group are out-of-school. In that case, estimation based on ASER is the best to use, which can be computed for six to 11, 11 to 13, 6 to 13, 15 to 16, & 17 to 18, or the entire school-going age group of 6 to 18 years. Because of this, the state-specific number of out-of-school children has been computed based on AgSER and presented in Table 10 gender-wise. Both the projected child population and AgSER have been based on UDISEPlus 2021-22 data. The critical analysis is presented below:
National Perspective: The data shows approximately 48.4 million out-of-school children in India (Boys, 26188466 & Girls, 22172575) during the academic year 2021-22. This figure is an alarming concern and requires urgent attention from policymakers and stakeholders in the education sector, especially if India desires to have a GER of 100 percent at the school level by 20230.
|
Table 10: Out-of-School Children calculated based on Age-Specific Enrolment Rate by Gender & Level of School Education, 2021-22 |
||||||||||||
|
State/UT |
Age 6-13 years | Age 14-15 years | Age 16-17 years | Age 6-17 years | ||||||||
| Boys | Girls | Total | Boys | Girls | Total | Boys | Girls | Total | Boys | Girls |
Total |
|
| India | 4344560 | 2241350 | 6593720 | 6798330 | 6369404 | 13171600 | 15045576 | 13561821 | 28596672 | 26188466 | 22172575 | 48361992 |
| A & N | 10788 | 8943 | 19688 | 3307 | 2231 | 5542 | 5050 | 3973 | 9034 | 19144 | 15147 | 34265 |
| Andhra Pradesh | 88247 | 93819 | 182497 | 183540 | 211416 | 395892 | 501085 | 472209 | 973248 | 772872 | 777444 | 1551637 |
| Arunachal Pradesh | 1847 | 0 | 0 | 13519 | 11852 | 25355 | 19666 | 18298 | 37952 | 35031 | 30150 | 63307 |
| Assam | 0 | 0 | 0 | 283318 | 198900 | 481593 | 482330 | 434868 | 916626 | 765648 | 633768 | 1398219 |
| Bihar | 507672 | 171760 | 668220 | 1391846 | 1259296 | 2652748 | 2291375 | 2124626 | 4415434 | 4190893 | 3555682 | 7736402 |
| Chandigarh | 20053 | 7717 | 27848 | 4329 | 290 | 4620 | 10205 | 5568 | 15791 | 34587 | 13574 | 48259 |
| Chhattisgarh | 213984 | 189659 | 401120 | 140610 | 105072 | 245717 | 259652 | 204978 | 464950 | 614246 | 499709 | 1111787 |
| D & N & D & D | 56916 | 48861 | 105777 | 14026 | 10868 | 24894 | 16205 | 10445 | 26650 | 87147 | 70174 | 157321 |
| Delhi | 0 | 0 | 0 | 0 | 0 | 0 | 100284 | 52456 | 153675 | 100284 | 52456 | 153675 |
| Goa | 16345 | 11471 | 27847 | 8379 | 4928 | 13333 | 12371 | 10123 | 22524 | 37096 | 26522 | 63704 |
| Gujarat | 613304 | 397902 | 1009580 | 392788 | 382272 | 775557 | 859488 | 750295 | 1611584 | 1865580 | 1530469 | 3396721 |
| Haryana | 58185 | 32022 | 90459 | 55998 | 56088 | 112560 | 265080 | 234500 | 498939 | 379263 | 322610 | 701958 |
| Himachal Pradesh | 0 | 0 | 0 | 9028 | 7236 | 16330 | 52125 | 44400 | 96524 | 61153 | 51636 | 112854 |
| Jammu and Kashmir | 169632 | 123657 | 293433 | 154940 | 130416 | 285069 | 192340 | 170422 | 362870 | 516912 | 424495 | 941372 |
| Jharkhand | 196056 | 137334 | 337904 | 336544 | 299106 | 635208 | 551475 | 498475 | 1050912 | 1084075 | 934915 | 2024024 |
| Karnataka | 0 | 0 | 0 | 222352 | 212310 | 434720 | 611029 | 552080 | 1164016 | 833381 | 764390 | 1598736 |
| Kerala | 0 | 0 | 0 | 58240 | 46314 | 103734 | 234752 | 203406 | 438700 | 292992 | 249720 | 542434 |
| Ladakh | 7127 | 7882 | 15193 | 3414 | 2787 | 6181 | 3977 | 3943 | 7933 | 14518 | 14612 | 29307 |
| Lakshadweep | 1481 | 1746 | 3228 | 567 | 455 | 1021 | 608 | 757 | 1366 | 2656 | 2958 | 5614 |
| Madhya Pradesh | 1240740 | 1168638 | 2416840 | 557032 | 556372 | 1114700 | 961920 | 911913 | 1873179 | 2759692 | 2636923 | 5404719 |
| Maharashtra | 0 | 0 | 0 | 242535 | 250040 | 490647 | 805222 | 739170 | 1543560 | 1047757 | 989210 | 2034207 |
| Manipur | 0 | 0 | 0 | 16506 | 14539 | 31018 | 23022 | 22326 | 45345 | 39528 | 36865 | 76363 |
| Meghalaya | 0 | 0 | 0 | 15376 | 4361 | 19739 | 37186 | 28450 | 65711 | 52562 | 32811 | 85449 |
| Mizoram | 0 | 0 | 0 | 2823 | 1553 | 4393 | 9782 | 7714 | 17485 | 12605 | 9267 | 21878 |
| Nagaland | 36959 | 25039 | 61897 | 24030 | 18368 | 42373 | 33489 | 29224 | 62742 | 94478 | 72631 | 167011 |
| Odisha | 208104 | 199290 | 404547 | 269960 | 243754 | 515264 | 589761 | 546375 | 1136445 | 1067825 | 989419 | 2056256 |
| Puducherry | 25093 | 21703 | 46737 | 10383 | 6929 | 17358 | 16569 | 13971 | 30538 | 52046 | 42604 | 94633 |
| Punjab | 30974 | 0 | 27000 | 37500 | 20650 | 58432 | 149384 | 120249 | 268636 | 217858 | 140899 | 354068 |
| Rajasthan | 405914 | 371072 | 777735 | 269893 | 351378 | 623220 | 767259 | 768712 | 1534216 | 1443066 | 1491162 | 2935171 |
| Sikkim | 6097 | 5948 | 12007 | 3468 | 2866 | 6342 | 6412 | 5669 | 12073 | 15978 | 14483 | 30422 |
| Tamil Nadu | 52224 | 0 | 41895 | 112918 | 77234 | 189312 | 590304 | 524770 | 1114725 | 755446 | 602004 | 1345932 |
| Telangana | 0 | 0 | 0 | 68544 | 68086 | 136735 | 303688 | 298200 | 603393 | 372232 | 366286 | 740128 |
| Tripura | 0 | 0 | 0 | 17731 | 12981 | 30609 | 38351 | 30030 | 68364 | 56082 | 43011 | 98973 |
| Uttar Pradesh | 1410068 | 772290 | 2188680 | 1663689 | 1730160 | 3395952 | 3372593 | 3126900 | 6500026 | 6446350 | 5629350 | 12084658 |
| Uttarakhand | 0 | 0 | 0 | 29376 | 21201 | 51408 | 109088 | 91872 | 200872 | 138464 | 113073 | 252280 |
| West Bengal | 0 | 0 | 0 | 229968 | 89320 | 316837 | 775008 | 510692 | 1283832 | 1004976 | 600012 | 1600669 |
| Source: UDISE+ 2021-22 | ||||||||||||
State & Union Territory Variations: Looking at the state-wise data, we observe significant disparities in the number of out-of-school children across different country regions. States like Bihar (7736402), Madhya Pradesh (5404719), and Uttar Pradesh (1208465) have a substantial number of out-of-school children, while some States & Union Territories, like Delhi and Kerala, have reported zero out-of-school children in certain age groups.
Gender Disparities: Gender disparities in access to education are evident from the data. In most states, the number of out-of-school boys is higher than that of girls, indicating that boys face additional barriers to education in several regions of the country. At the all-India level, this is true for age groups 6 to 13, 14 to 15, and 16 to 17, which is also true for Bihar, Madhya Pradesh, and Uttar Pradesh. Efforts must be made to bring all the boys under the education fold and ensure that every child who enters the system is retained and transit to the next grade/level.
Age-Specific Enrollment Rate: The data on age-specific enrollment rates highlights the importance of retaining children in school beyond 14. We see a significant drop in enrollment between the ages of 14 and 15, and the trend continues in the 16-17 age group.
The data presented in Table 10 calls for targeted interventions and policy measures to address the issue of out-of-school children. The following are some of the critical policy implications:
- Focused Efforts on Boys’ Education: In order to narrow the gender gap in education, it is crucial to concentrate on initiatives that are tailored to boys’ enrollment and retention in schools. These initiatives must consider the cultural, societal, and economic challenges that hinder boys’ and girls’ access to education. Focusing on these targeted efforts may create an inclusive and equitable educational environment for all.
- Enhanced Support for Disadvantaged States: States with more out-of-school children require increased attention and resources to improve the education infrastructure and provide better learning opportunities for all children.
- Strengthening School Systems: Strengthening the school system and making it more inclusive can be crucial in reducing the number of out-of-school children. This involves providing quality education, engaging teaching methods, and ensuring access to schools in remote areas.
- Promoting Vocational and Skill Development: For children who have crossed the age of 14, dropped out of school, and are currently out of school, vocational and skill development programs can offer an alternative path to acquiring essential skills and becoming employable.
- Data Accuracy & Monitoring: Accurate and up-to-date data are essential for formulating effective policies and programs. Regular monitoring and evaluation of educational initiatives will help track progress and identify improvement areas.
Reasons for Dropout & Out-of-School
Just estimating and knowing the numbers of out-of-school children will not serve the purpose unless the reasons for their being discontinued are known, and strategies are formed reason-specific. The NSSO 75th Round and NFHS 5th provide data on the reasons for child dropout in India. According to the NSSO 75th Round, economic hardship is the most common reason for child dropout (38 percent). Other reasons include child labor (22 percent), distance to school (12 percent), and poor quality of education (10 percent). The NFHS 5th found that the most common reason for child dropout among girls is marriage (26 percent), followed by economic hardship (22 percent) and child labor (18 percent).
The Government of India has taken many steps from time to time to address the problem of child dropout, such as providing free education and midday meals to students and launching nationwide programs such as Sarva Shiksha, RMSA, RTE, Samagra Shiksha and other such programs. However, more must be done to ensure that all children in India have access to quality education. The government needs to increase funding so that all schools can be equipped with the resources they need to provide quality education. In addition, the government needs to reduce child labor so that more children can attend school. The government needs to encourage children by providing scholarships and other incentives. The government needs to improve the quality of education by providing better-trained teachers and a more engaging curriculum. Further, the government needs to make schools more accessible by building more schools in rural areas and providing transportation for students far from school, and revamping data on habitations having got access to schooling facilities like once gathered as a part of the All India School Education Survey conducted by the NCERT in the past.
Concluding Observations
India’s efforts to achieve universal education enrollment have seen significant progress at the primary level. However, the same cannot be said for secondary and higher secondary education, where the number of out-of-school children remains alarmingly high. In 2021-22, the estimated number of out-of-school children aged 6 to 17 reached a staggering 48.4 million, which accounts for about 17 percent of the total population within this age group.
While the primary level provides a glimmer of hope with attainable universal enrollment, challenges persist even at this level. Despite initiatives like Sarva Shiksha Abhiyan and similar programs, many children are still out of school, particularly in the age groups corresponding to secondary and higher secondary education.
India must take decisive action to achieve its target of a 100 percent Gross Enrollment Ratio at the school level by 2030. Concerted efforts are required on a war footing to address the issue of out-of-school children and improve access to quality education for all.
To tackle the problem effectively, a comprehensive overhaul of the existing plan formulation process is necessary. Engaging national institutions like the National Institute of Educational Planning and Administration becomes crucial in this endeavor. NIEPA should lead in developing a revised planning module to effectively align efforts from Sarva Shiksha, teacher education, and the Rashtriya Madhyamik Shiksha Abhiyan.
Collaboration between NIEPA, the Technical Support Group of the Department of School Education & Literacy under the Ministry of Education, and Samagra Shiksha is essential. This collaboration should ensure that Annual Work Plans & Budgets are developed in a coordinated and professional manner, pooling resources and expertise to address the issue holistically.
To conclude, one may observe that India’s quest for universal education enrollment faces significant challenges at the secondary and higher secondary levels, where a substantial number of children are out of school. While primary education shows promise, there is still work to be done. To attain the ambitious target of 100 percent GER by 2030, it is imperative to revamp the planning process and foster collaboration among key national institutions. By focusing on inclusive and quality education, India can unlock the potential of its young population and pave the way for a brighter future for the nation.


