India Education Data Series
India’s Census 2027:
What a 16-Year Population Data Gap Means for School Education
GER, NER, OOSC Estimates and SDG 4 Reporting Are All Built on Projected Data — And Will Remain So Until 2029
Every GER, NER, and estimated OOSC figure (published by the author) published by UDISE+ since 2013–14 has used projected — not actual — population denominators. District-level education indicators are particularly unreliable. Errors in the denominator are large enough to misidentify which states and districts need the most urgent intervention.
An Unprecedented Statistical Gap
When the Government of India notified the Census 2027 schedule in June 2025 — Phase 1 (House Listing) April–September 2026, Population Enumeration from 1 March 2027 — it confirmed what education planners had feared. India will have gone sixteen years without a fresh population census by the time the 2027 count is completed.
This is unprecedented in India’s post-independence statistical history. Even during the Second World War, the census was held in 1941 as scheduled. The current delay is the first time since independence that India has missed a decennial census cycle.
The consequences for school education planning have received far less attention than those for health or electoral delimitation — and they are severe. This article documents those consequences precisely, using UDISE+ 2024–25 data released on 28 August 2025.
“The first UDISE+ report to use a verified Census population denominator will be for the academic year 2028–29 at the earliest — eighteen years after the last such verified baseline.”
GER vs NER by School Level
The gap between GER and NER partly reflects denominator uncertainty. NER is especially sensitive to projection error because it requires single-year age counts, not broad age-group totals.
NER
(Class I–V)
(VI–VIII)
(IX–X)
(XI–XII)
Source: UDISE+ 2024–25 Report, Ministry of Education, Government of India. All figures use projected population denominators.
Which Indicators Can Be Trusted?
Not all indicators are equally affected. Analysis that does not require a population denominator — enrolment trends, infrastructure, teacher deployment — remains valid. It is the ratios and rates that carry unquantified uncertainty.
| Indicator | Denom. Age | Severity | Key Risk |
|---|---|---|---|
| GER — National | 14 yrs | Medium | Directional trend valid; absolute level uncertain |
| GER — State | 14 yrs | Medium | Rapid-transition states may show artificially low GER |
| GER — District | 14 yrs | High | District projections unreliable; planning may be misdirected |
| NER — All levels | 14 yrs | High | Requires single-year age counts; most sensitive to error |
| OOSC Count | 14 yrs | High | 5% denominator error = 11–15 lakh OOSC error |
| Higher Ed. GER | 14 yrs | Medium | Likely overstates 18–23 pop. — understates true HE GER |
| Literacy Rate | Frozen 2011 | High | No national update since 2011; entire indicator frozen |
| SDG 4 (UNESCO) | 14 yrs | High | All pop.-denominated SDG 4 indicators carry unquantified uncertainty |
| Enrolment Trend | None | Low | Census-independent; fully reliable for trend analysis |
| School Infrastructure | None | Low | Count-based; fully Census-independent |
What Census 2027 Must Deliver
Priority release of district-level age-specific population tables
The Ministry of Education should formally request ORGI to publish these within 12 months of Population Enumeration — by March 2028. Age is among the first variables processed in Census tabulation.
Harmonise the school attendance question with UDISE+ categories
Distinguish Government, Government-Aided, Unaided Private, and Unrecognised institutions — matching UDISE+ management-type categories to enable definitive OOSC triangulation.
Definitively update the literacy baseline
The last national literacy figure is from Census 2011 (74.0%). After sixteen years of SSA, RTE, Samagra Shiksha, and NIPUN Bharat, the true literacy rate is unknown. Census 2027 must fix this for SDG 4 reporting to 2030.
Capture migration and urban–rural compositional change
Internal migration and urbanisation have fundamentally reshaped the geography of educational need. District-level planning assumptions embedded in UDISE+ are increasingly implausible without this data.
Link Census school attendance data to UDISE+ school codes
Through Aadhaar matching and APAAR, it may be technically feasible to link Census-recorded school attendance to UDISE+ school records — providing the most accurate OOSC estimate India has ever had.
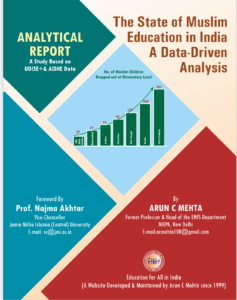
Download the Full Report
Access the complete analysis including all data tables, projection methodology critique, and SDG 4 implications.