Understanding School Education through Enrolment Ratios 2022
Samagra Shiksha: UDISE+ 2020-21
Universalization & its Components
There are four components of universalization of school education, namely universal access, universal participation, universal retention, and quality of education of which the universal enrolment is the most important one which presents the participation of children of an age group in educational programs.
Universalization in India means universal access (school facilities to all), universal participation (all relevant age group children enrolled), universal retention (meaning all those who enter into the system retain and transit from one level of education to another), and universal quality of education (satisfying criteria of minimum levels of learning).
Universalization of Enrolment
Though over time impressive progress is made on the first three components of universalization the quality of education is still a major area of concern. The main source of information on the first three components is the Unified District Information System for Education-Plus (being managed by the Department of School Education and Literacy of the Ministry of Education) which is the latest available for the year 2020-21.
On the other hand, the main source of information on the quality of education is the National Achievement Survey being conducted by the NCERT the first of which was conducted in 2017, and the second survey was conducted on November 12, 2021, the results of which are released recently. Details of NAS 2021 can be obtained from National Achievement Survey and UDISE+ 2020-21 Booklet presents State-specific data that can be downloaded from the UDISE+ portal.
The user can download a set of pre-determined tables (2012-13 to 2020-21) without registration at different levels, such as block, district, state as well as at the all-India level.
A registered user can download micro (raw) data which is made available for the period 2018-19 to 2020-21. Before 2012-13, raw data for the period 2005-06 to 2017-18 along with a set of publications based on UDISE can be accessed at School Reprot Cards which is still being managed by NIEPA, New Delhi even after UDISE operations are now being managed by the Ministry of Education.
One of the main objectives of the Government of India’s flagship program, namely Samagra Shiksha Abhiyan is to ensure that schooling facilities are made available to all children addition to which enrolling all children is another important objective that has been discussed in the present article by taking examples based on actual UDISE+ 2020-21 data at the all-India level and wherever possible state-specific data has also been presented.
The following levels of education have been covered in this article:
- Primary
- Upper Primary
- Secondary and
- Higher Secondary level.
So far as the enrolment ratios are concerned, Gross, Net Enrrrolment Ratios (NER) as well as Adjusted NER and Age-specific Enrolment Ratio (ASER), have been discussed by taking examples along with the implication of a ratio on achieving the goal of universal school education in India which is also resolved to be achieved by 2030 and is specified in the National Education Policy (NEP 2020).
The National Educational Policy (2020) has recommended several changes for school education which has got far-reaching implications one of which is restructuring the composition of school education. At present, in India Primary education level consists of Grade I to V (corresponding age-group 6+ to 10+ years), Upper Primary level consists of Grades VI to VIII (age-group 11+ to 13+ years), Secondary (Grades IX & X/14+ to 15+ years), and Higher Secondary Level of education (XI & XII/16+ to 17+ years). Instead of present levels, the NEP (2020) proposed:
- Foundational Stage of School Education (3 years of Pre-primary education including Grades 1 and 2 with corresponding age-group 3 to 8 years)
- The preparatory phase consists of 3 years i.e. Grades 3, 4 and 5
- Middle School Education of 3 years (Grades 6, 7, and 8); and
- Secondary Education phase of 4 years consisting Grades 9, 10, 11, and 12. The corresponding clientele age groups of these phases would be Phase I (3+ to 7+ years), Phase II (8+ to 10+years), Phase III (11+ to 13+ years), and Phase IV (14+ to 17+ years).
While new indicators that need to be computed or re-look into are separately been discussed, in this article a variety of enrolment ratios have been discussed at different levels of education. Enrolment Ratios have been presented for the latest year, namely 2019-20 and 2020-21, and are based on UDISE+ data.
Gross Enrolment Ratio (GER)
The Gross Enrolment Ratio at the primary level of education has increased to 103.3 percent in 2020-21 from its previous level of 102.7 percent in 2019-20 which indicates that 103.3 percent of 118.14 million children of the age group 6 to 11 years including the overage (above 11 years) and underage (below 6 years) children are enrolled in the corresponding level of education, namely the primary level of education which can be considered only a crude indicator of children participation at a level of education (Table 2).
How GER at the primary level is computed which is simply described as the total enrolment in Classes 1 to V including overage 11-year and underage 6-year children which is then divided by the corresponding child population supposed to be in the corresponding Classes 1 to 5. GER at the primary level based on Table 1 comes out to be:
GER at Primary level = 122.02 million (Classes 1 to 5)/118.14 million (6 to 10 years age population) which is then multiplied by 100 gives a GER of 103.28 percent. Similarly, GER for Boys (63.53 million/62.15 million, 102.22 percent) and (58.49 million/55.99 million, 104.47 percent) for girls can also be obtained. Ensure that your GER for total enrolment lies between GER for Boys and Girls which is true for all levels of education.
Compared to 103.3 percent GER at the primary level, the same at the upper primary level of education is reported to be 92.2 percent as compared to 99.1 percent for the entire elementary (Classes I to VIII) level of education. In the GER, as mentioned above total enrolment at a level of education is considered instead of enrolment of the corresponding age group; thus presenting a misleading picture of children’s participation. Hence, GER cannot be considered a true indicator of children’s participation.
Even though, overage and underage children are included in GER, the same at the secondary and higher secondary level of education is as low as 79.8 and 53.8 percent respectively; thus indicating that a large number of children of the corresponding age group are not enrolled in these levels of education; they might either be out of the system, dropped out or never enrolled or a few of them are enrolled in the lower level of education, such as primary and upper primary levels of education.
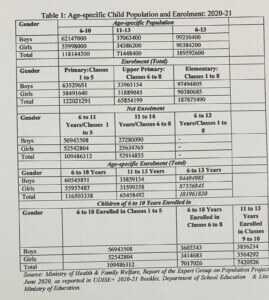
Table 1; Child population and Enrolment 2020-21
Limitations of GER
What is the meaning of a GER of 92.2 percent at the upper primary level of education? Are the remaining 7.8 percent of children can be treated as out-of-school? It may also be observed that overage (above 13 years) and underage (below 11 years) children are also included in 92.2 percent of GER because of which it is not possible to exactly know the participation of children of 11 to 13 years old in the corresponding upper primary classes.
Thus, the remaining 7.8 percent of children cannot be treated as out-of-school as a few of them may be enrolled in the lower or even above levels of education, and remaining may be treated as the dropped out or never enrolled children. Given the limitations that have been highlighted above, the GER is treated only as a crude indicator because of which alternative indicators, such as NER have been explored.
Net Enrolment Ratio (NER)
Unlike GER, Net Enrolment Ratio considers only enrolment of the corresponding age and not the total enrolment. For example, NER at the primary level of education considers enrolment in Classes I to V of the corresponding age group, i.e. 6 to 10 years, and similarly for other levels of education. At the primary level of education, UDISE+ 2020-21 reported a NER of 92.7 percent; as compared to 91.4 percent in the previous year i.e. 2019-20.
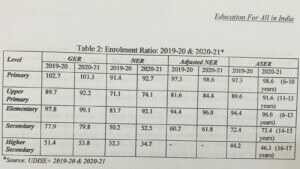
Table 2: Enrolment Ratios, 2019-20 and 2020-21
How NER at the primary level is computed which is simply described as the total enrolment in Classes 1 to 5 of 6 to 11 years (also called net enrolment) which is then divided by the corresponding child population i.e. 6 to 11 years. NER at the primary and upper primary level based on Table 1 comes out to be:
NER at Primary level = 109.49 million (Classes 1 to 5)/118.14 million (6 to 10 age population) which is then multiplied by 100 gives a NER of 92.68 percent.
NER at Upper Primary level = 52.91 million (Classes 6 to 8)/71.45 million (11 to 13 age population) which is then multiplied by 100 gives a NER of 74.05 percent.
Limitations of NER
What is the meaning of 92.7 percent NER at the primary level of education? Is it means that the remaining 7.3 percent of 6 to 11-age children are out-of-school? Not necessarily so as a few of them may be enrolled in lower primary level and a few may even be enrolled in one level higher i.e. upper primary level. Thus a NER of 92.7 percent indicates that 92.7 percent of children from 6 to 10 years old are enrolled in corresponding Classes 1 to 5 but the remaining children need not be considered out of school.
As per the policy directives, all children of the 6 to 10 age group are supposed to be enrolled in the corresponding Classes 1 to 5 but in the reality, it may not be true as children do enter into the system before and after the completion of age-6 (known as entry age) because of which there are always underage and overage children at all levels of education which is not considered while computing NER which consider net enrolment of age 6 to 10 years in the corresponding Classes 1 to 5.
Because of this, NER is considered a better indicator of children participation but is not free from limitations as it ignores underage and overage students though they are very much part of the system.
Then which indicator is better GER or NER or do we think of some alternative indicator, before that let us have a look at NER at other levels of education.
NER at other Levels of Education
Further, it has been observed that compared to NER at the primary level (92.7 percent), other levels of education have much lower NER, upper primary (74.1 percent), secondary (52.5 percent), and higher secondary (34.7 percent) level all which suggest that concerted efforts are required to make India moving towards the goal of universal school education.
It has also been observed that NER for the entire elementary level of education (Classes 1 to 8) is observed to be 92.1 percent in 2020-21 which indicates that the remaining 7.9 percent of children of 6 to 13 years were not enrolled in the corresponding Classes 1 to 8 all of which as has already been explained can not be treated as out of school, as a few of them may be enrolled in one level above and a few may even be termed as never enrolled or out of school.
In percentage terms, it is only 7.9 percent but the same in absolute terms is as high as 14.98 million which may be termed as huge and has serious implications for India to attain the goal of universal school enrolment.
NER at the higher secondary level in 2020-21 further indicates that it is low at 34.7 percent as compared to 52.5 percent at the secondary level; all of which points that goal of universal secondary education in the Country is far out of reach of 100 GER at the secondary level, as envisaged in NEP 2020; concerted efforts are required to attain the same by 2030.
Projected Child Population
As per the Report of the Expert Group on Population Projections (Ministry of Health & Family Welfare, June 2020) also used in UDISE+ 2020-21 for computation of enrolment ratios, the total population of 6 to 14 years in 2020-21 in the Country was as high as 189.59 million of which 62.31 percent (118.14 million) were of primary school age and the remaining 37.69 percent (71.45 million), upper primary school-age children. Needless to mention that a slight underage/overage population may dramatically change the enrolment ratio.
Adjusted-NER
Though improved over the GER, the NER still has limitations because it does not consider children in Classes 1 to 5 those who are either underage or overage addition to which it also doesn’t consider enrolment aged 6 to 10 years who are not currently enrolled in corresponding Classes 1 to 5 but are enrolled in one level above i.e. upper primary level, Classes 6 to 8.
Because of these limitations, UNESCO/UIS suggested using the improved version of NER and termed it Adjusted-NER which is defined as “enrolment of the official age group for a given level of education either at that level or the levels above, expressed as a percentage of the population in that age group”.
For example, the number of pupils in the primary school age group (6 to 10 years) enrolled either in primary or upper primary grades expressed as a percentage of the corresponding population (6 to 10 years) is termed as Adjusted-Net Enrolment Ratio at the primary level of education.
Let us compute Adjusted-NER at the primary level by using actual UDISE+ 2020-21 data presented in Table 1:
Adjusted-NER (Primary) = 6 to 10 years old enrolled in Classes 1 to 5 + 6 to 10 years enrolled in Classes 6 to 8 is divided by the total 6 to 10 years old population
(109486312+7017026)/(118144200)*100 = 98.61 percent
Adjusted-NER (Upper Primary) = 11 to 13 years old enrolled in Classes 6 to 8 + 11 to 13 years enrolled in Classes 9 to 10 is divided by the total 11 to 13 years old population
52914855+7420526)/(71448400)*100 = 84.49 percent
All of which match well with the published UDISE+ Report for 2020-21. Likewise, by following the same methodology we get an Adjusted-NER of 96 percent for elementary and 61.8 percent for the secondary level of education in India.
Interpretation of Adjusted-NER
The next question which may crop up in our mind is what is the interpretation of an Adjusted-NER of 98.61 and 84.49 percent respectively at the primary and upper primary level of education. Needless to mention that we have already discarded the usefulness of both the Gross as well as Net enrolment ratio. We obtained an Adjusted-NER of 98.61 percent against a GER of 103.3 percent and 92.7 percent NER at the primary level.
As has already been explained that in the NER, only net enrolment of the corresponding age-group population is considered even though a few children of the same age group are enrolled in one level above that level i.e upper primary but are not considered in computing NER, which we have termed as limitation of NER; in the Adjusted-NER, such children are considered.
Thus an Adjusted-NER of 98.61 percent indicates that 98.61 percent of the total 6 to 10 years population are enrolled either in the Classes 1 to 5 and/or in Classes 6 to 8. Can the remaining 1.39 percent of children of 6 to 11 years be termed as out of school who can either be dropped out, never enrolled, or are currently not enrolled in the corresponding Classes 1 to 5? However, a few of them may be enrolled in lower pre-primary centers.
It may be recalled that NER at the primary level was 92.7 percent against 98.61 percent of Adjusted-NER; thus indicating that about 5.91 percent of children of 6 to 11 years were enrolled in one level above the primary level, i.e. upper primary level which otherwise are considered out-of-school based on net enrolment ratio. These children might have entered into the system earlir than the prescribed age.
Let us now have a look at Adjusted-NER at other levels of education. Adjusted-NER at the upper primary level in 2020-21 is 84.4 against 74.1 percent of NER; thus indicating that more than 10 percent of the total 71.45 million 11 to 13 years of children are enrolled in classes one level above i.e. Classes 9 to 10.
The corresponding NER and Adjusted-NER for the entire elementary level of education are 92.1 and 96 percent respectively; thus again indicating that there are underage children both at the primary as well as upper primary level of education a few of them of 6 to 13 years old are even enrolled in Classes 9 and 10. On the other hand, GER indicates a huge number of both underage as well as overage children which is true for all the levels of education.
Impact of Universalisation on GER & NER
As we move towards universalization, children will start entering the education system (through Class I) at the prescribed age i.e. age-6 years which would bridge the gap between the GER and NER; at the state of universalization eventually, GER would become NER and there would not be overage and underage children in enrolment which would also be true for other levels of education (ignoring repeaters which are only a few).
UDISE+ 2020-21 data further reveals that compared to a 96 percent Adjusted-NER at the elementary level of education, the same at the secondary level of education is as low as 61.8 percent; thus indicating that only 61.8 percent of the total 48.90 million children of 14 to 15 years were enrolled in the corresponding Classes 9 and 10, a few of them are also enrolled in Classes 10 and 11. A hoping 38.2 percent of children of this age group are not enrolled in these classes which in the absolute terms comes out to be 18.68 million; thus meaning that almost 19 million children of age 14 and 15 years were not enrolled in the corresponding classes in 2020-21.
Age-specific Enrolment Ratio?
From the above analysis, it seems that NER is a better indicator of children’s participation than GER. Further, it has been observed that Adjusted-NER is better than NER but still children enrolled in lower classes are not considered. It is a constitutional commitment to ensure that every child between the age of 6 to 14 years must be enrolled in the corresponding class but both the GER as well as NER and Adjusted-NER fail to present an overall view of the participation of an individual age or age-group in educational programs.
Alternatively, an age-specific enrolment ratio may be considered which gives the enrolment ratio for a particular age or age group. For example, an age-specific enrolment ratio of single-age ‘8’ will include total enrolment of age ‘8’ irrespective of grades which is then divided by the single-age population ‘8’ to obtain the ratio. Similarly, the age-specific enrolment ratio can also be computed for 6 to 11, 11 to 14, or 6 to14 years and age groups.
Let us demonstrate how the Age-specific Enrolment Ratio (ASER) for a particular age group, namely 6 to 11 years based on the UDISE+ 2020-21 data is calculated. It considers the total enrolment of age group 6 to 11 years irrespective of class, total enrolment of age 6 to11 years are considered irrespective of a class or a level of education.
Age-specific Enrolment Ratio: 11,65,03,338 is the total enrolment of 6 to 11 years which is then divided by the total child population of 6 to11 i.e. 11,81,44,200 which is then multiplied by 100 to get the Age-specific Enrolment Ratio, i.e. 98.61 percent. By employing the same methodology, ASER for the age group 11 to 13 is obtained as 91.62 percent. How do we interpret ASER?
Interpretation of Age-specific Enrolment Ratio
To understand the meaning of Age-Specific Enrolment Ratio, let us discuss the same by taking the example of the 6 to 10-year age group for which we would also analyze the GER, NER, and Adjusted-NER at the primary level of education:
- GER, Primary Level =103.7 percent
- NER, primary Level = 92.7 percent
- Adjusted-NER, primary Level = 98.61 percent
- Age-Specific Enrolment Ratio (6 to11 years) = 98.61 percent
An Age-specific Enrolment Ratio of 98.61 percent of 6 to11 years indicates that 98.61 percent of the total 118.14 million children of this age group are enrolled but are not necessarily be enrolled in the corresponding Classes 1 to 5 as this enrolment ratio considers total enrolment irrespective of a class or level of education. This otherwise means that only 1.39 percent of the total children of 6 to 11 years are not currently enrolled in any class which can be termed as out of school, dropped out, or never been enrolled, children.
It may be recalled that the interpretation of different types of enrolment ratios is different. ASER is free from the limitation of over age and under age children observed in the case of GER and NER (ignore over and above age children), as well as students, enrolled in one level above then the prescribed level observed in the case of the Adjusted-NER and presents the true picture of the participation of an age group children irrespective of corresponding
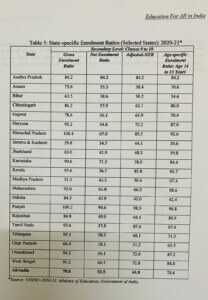
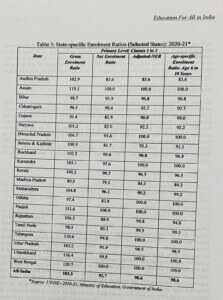
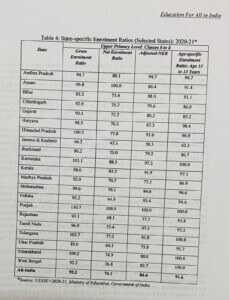
Table 6: State-specific Enrolment Ratios (Selected States): Higher Secondary Level, 2020-21*
|
State |
||||
| Gross Enrolment Ratio | Net Enrolment Ratio | Age-specific Enrolment Ratio: Age 16 to 17 Years | ||
| Andhra Pradesh | 53.4 | 53.4 | 53.4 | |
| Assam | 32.3 | 21.9 | 32.9 | |
| Bihar | 34.0 | 17.8 | 23.4 | |
| Chhattisgarh | 57.6 | 38.2 | 59.9 | |
| Gujarat | 41.8 | 30.0 | 40.4 | |
| Haryana | 66.8 | 38.7 | 54.1 | |
| Himachal Pradesh | 85.6 | 56.5 | 66.5 | |
| Jammu & Kashmir | 50.1 | 29.0 | 37.0 | |
| Jharkhand | 43.9 | 26.1 | 37.6 | |
| Karnataka | 55.6 | 41.3 | 47.6 | |
| Kerala | 84.2 | 64.0 | 72.0 | |
| Madhya Pradesh | 45.4 | 26.6 | 43.7 | |
| Maharashtra | 68.2 | 43.5 | 66.2 | |
| Odisha | 46.4 | 42.6 | 43.3 | |
| Punjab | 77.8 | 46.6 | 60.6 | |
| Rajasthan | 62.1 | 35.6 | 56.8 | |
| Tamil Nadu | 76.5 | 46.6 | 46.6 | |
| Telangana | 61.8 | 37.7 | 47.9 | |
| Uttar Pradesh | 48.8 | 27.6 | 38.4 | |
| Uttarakhand | 72.7 | 44.0 | 59.9 | |
| West Bengal | 58.5 | 41.9 | 57.6 | |
| All-India | 53.8 | 34.7 | 46.3 | |
*Source: UDISE+2020-21, Ministry of Education, Government of India.
class/level of education. It presents the percentage of children enrolled which means that out of 98.61 percent of children enrolled a few of them may also be enrolled in the above levels than the prescribed level. ASER in other words presents the net number of children enrolled which has nothing to do with a class or the level of education.
Hope that difference between this ratio and GER and NER is clear both of which are computed for a level of education i.e. primary or upper primary level. Thus, when the objective is to review the participation of children of an age group or a single age, ASER may be a good option. Depending upon the objective as well as the availability of enrolment data, one can use GER, NER, or Adjusted-NER all of which has some sort of limitations and advantages over the other.
Is the high enrolment ratio sufficient?
No, by just having a hundred percent NER or Adjusted-NER, that itself doesn’t guarantee that we shall achieve the goal of universal enrolment unless all the children of age-6 years enter into the system through Class I at the appropriate age which can be measured by a variety of indicators, like intake, admission or more popularly known as entry rate but this most crucial indicator doesn’t find a place in most of district annual plans and budget being formulated annually as a part of the flagship Samagra Shiksha Abhiyan program of the Government of India.
Enrolling all the children is a necessary condition and not a sufficient condition for which one has to ensure that whosoever enters into the system must retain and transit from one level to another level of education. Let us first discuss the meaning of the entry rate.
The basic indicator that gives an idea about coverage of child population (in a system) is the intake (entry) rate which is simply the division of enrolment in Grade I to the corresponding population at which a child is supposed to enter into the system (in most of the cases it is ‘6-year’).
However, while calculating the entry rate, repeaters, if any are not considered and only fresh (new) entrants in Grade I are considered. This is because repeaters are not the members of the present cohort but they have entered into the system some one or two years back. If data is available, one can also examine Grade I enrolment of those who have transited from the pre-school centers?
In the case of gross enrolment (including children below & above ‘6’ in Grade I), the entry rate calculated is known as Gross Entry Rate otherwise it is known as Net Entry Rate. The entry rate also known as the Admission or Intake rate demonstrates the capacity of the system concerning the availability of schooling facilities.
While calculating the net entry rate, net enrolment (new entrants) in Grade I of age ‘6’ is considered. For example, a gross entry rate of 80 percent means that about 80 percent of children (of entry age) including the overage and underage are enrolled but a net entry rate of 80 percent means that only 20 percent of children of entry age are out of the system or are yet to be enrolled.
The net entry rate is considered a better indicator of student coverage at the entry point (Grade I) than the gross entry rate. Unless the net entry rate is brought to a hundred percent, the goal of universal enrolment cannot be achieved. Entry rate is also useful in knowing likely enrolment in subsequent grades in years that follow which plays important role in enrolment projection exercises. Except, for the initial period of the DPEP, now district plans do not present an entry rate which is true for both the Sarva Shiksha Abhiyan program and the newly launched, Samagra Shiksha Abhiyan.
Is enrolling all 6-year children enough?
Enrolling all children of age-6 does not guarantee that the goal of universal enrolment will be achieved on its own, it is a necessary condition but not a sufficient condition. Children are to be retained in the system and should also acquire minimum levels of competencies.
For that purpose other indicators, such as Gross and Net enrolment ratio, dropout & retention rate, the transition from primary to upper primary level, and achievements levels should also be analyzed. The intake rate gives an idea about coverage of child population of entry age-6 in Grade I but it fails to give an idea about children who entered and then remained in the system in years that follow. For this purpose indicators concerning enrolment ratio at different levels and retention and transition rate from one level to another need to be analyzed.
State-specific Enrolment Ratios
State-specific enrolment ratios which have been presented in Tables 3 to 7 at primary, upper primary, secondary, and higher secondary levels of education reveal that India a far away from attaining the status of universal school education. Some of the major states have low to very low enrolment ratios which is more specifically true for secondary as well as higher secondary levels of education.
Most of the states have significant progress toward universal elementary education but a few such as Madhya Pradesh (NER, 79.3 at primary and 70.7 percent at upper primary level)), Bihar (NER, 75.4 percent at upper primary level), Jammu and Kashmir (NER, 47.1 percent at upper primary level), Jharkhand (NER, 73 percent at upper primary level), etc still have very low NER all of which indicate that concerted efforts are required to finish the unfinished task.
On the other hand, a few states have high to very high NER both at the primary as well as upper primary levels of education. Irrespective of an enrolment type both at the primary and upper primary levels of education, Punjab reported an enrolment ratio of 100 percent which needs further investigation this is also true for upper primary level of education, and secondary level ratios as well are also high and well above the all-India average and one of the most advanced states of the country, namely Kerala. There are a few other states all of which need a thorough review of enrolment trends.
Table 7: Enrolment Ratio, 2020-21: Punjab
| Level | GER | NER | Adjusted-NER | ASER |
| Primary | 111.6 | 100.0 | 100.0 | 100.0 |
| Upper Primary | 110.7 | 100.0 | 100.0 | 100. |
| Secondary | 109.2 | 94.6 | 98.5 | 98.8 |
| Higher Secondary | 77.8 | 46.6 | 60.6 |
Source: UDISE+ 2020-21
Concluding Observations
Quality of enrolment data as well as the corresponding age-specific population plays an important role in reviewing the participation of children in educational programs. Though both the grade-specific as well as level-specific enrolment is annually available from the administrative survey, such as the UDISE+ but the same is not true for the child population.
More specifically, at the district level, no child-specific population is available except during the Census year. For other years, the same can be projected by using the Report of the Expert Group on Population Projections (June 2020), Ministry of Health & Family Welfare, which has also been used in computing indicators reported in the UDISE+ Booklet produced by the Department of School Education & Literacy, Ministry of Education.
Though Expert Group Population Projections, are available only at the state and the all-India levels methodologies are available using through which both the single-age as well as aggregate child population in a year can easily be projected; even the same be projected at the block level. Depending upon the requirement, a particular enrolment ratio can be computed.
To the extent possible, the district annual plans must contain indicators both at the district and block levels, and wherever required separately for the boys and girls must also be presented.
By using the projection and target setting techniques, both the annual target as well target in the perspective year (over the next five years) must also be set out which is also mandatory in annual plans being formulated as a part of ongoing Samagra Shiksha. However, as of now, the Samagra Shiksha Guidelines are still in the draft form and in the lack of capacity-building exercises, the same is generally not found a place in the recently formulated district annual plans.
National-level institutions, such as NIEPA must be entrusted to modify the planning methodology as well as capacity building of officers engaged in plan formulation which has become a necessity because of the merging of SSA and RMSA into the form of Samagra Shiksha Abhiyan.
Needless to mention that district planning is still based on EXCEL tables and the academic flavor observed during the DPEP and the initial period of Sarva Shiksha Abhiyan is missing. Even the Joint Review Mission which is generally a regular feature has not been mounted in recent years. The Project Approval Board is the only body which is supposed to go through the detailed process of plan formulation both in the district as well as state plans?
- Indicators of Educational Development: Concept and Definitions
- Indicators of Educational Development: Definitions & Real Life Data, 55 Indicators
- Indicators of Educational Development
- Sustainable Development Goal 4: Quality Education, 2020-21 (India)
- Suggestive Monitoring Framework and Set of Indicators
- A Note on Educational Statistics in India 1993
- Education Indicators Technical Guidelines: UIS
- Educational Planning
- A Note on Educational Statistics in India-aruncmehta
- Understanding School Education through Enrolment Ratio (Download Full length) paper)

